puppy size\nweight (lb)\npuppy size\nweight (lb)\ndecide if the description is true for each type of data…
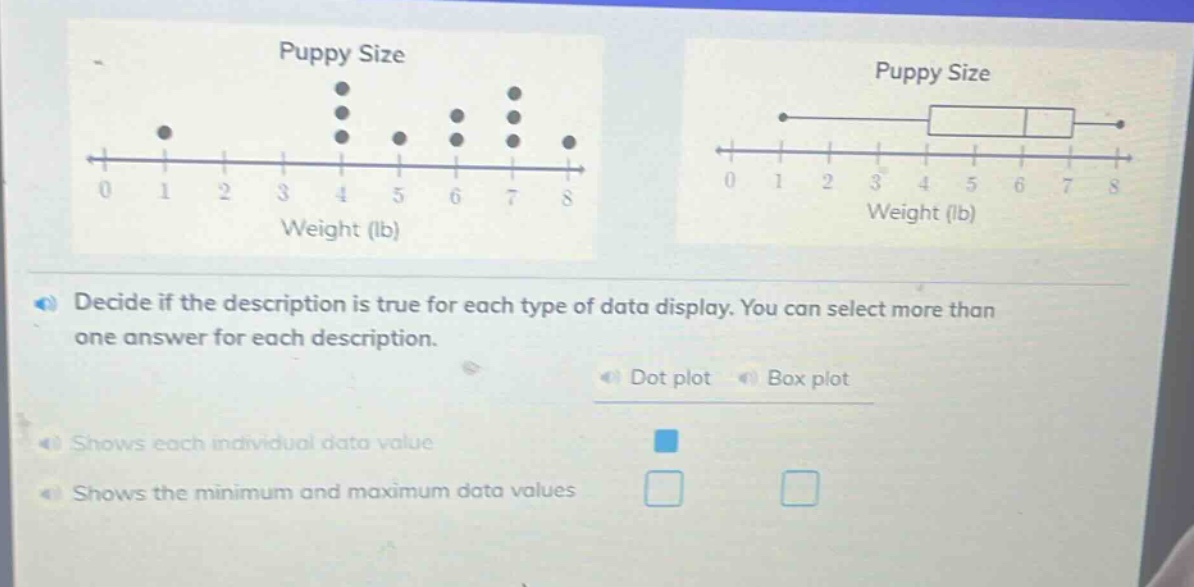
puppy size\nweight (lb)\npuppy size\nweight (lb)\ndecide if the description is true for each type of data display. you can select more than one answer for each description.\ndot plot box plot\nshows each individual data value\nshows the minimum and maximum data values
Answer
Brief Explanations:
- A dot - plot shows each individual data value as each dot represents one data point.
- Both a dot - plot and a box - plot show the minimum and maximum data values. In a dot - plot, the left - most and right - most dots indicate the minimum and maximum respectively. In a box - plot, the ends of the whiskers represent the minimum and maximum (assuming no outliers are shown separately).
Answer:
- Shows each individual data value: Dot plot
- Shows the minimum and maximum data values: Dot plot, Box plot