quadratic, or exponential regressions. which type of function best models the data shown on the scatterplot?
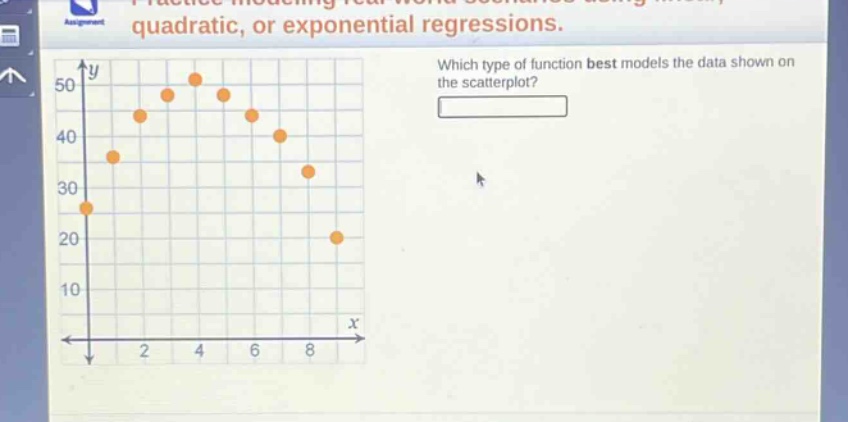
quadratic, or exponential regressions. which type of function best models the data shown on the scatterplot?
Answer
Explanation:
Step1: Observe the scatter - plot shape
The data points first increase and then decrease.
Step2: Recall function characteristics
A quadratic function can have a U - shaped (or inverted U - shaped) graph. An exponential function either grows or decays monotonically.
Answer:
quadratic