the quadratic regression graphed on the coordinate grid represents the height of a road surface x meters…
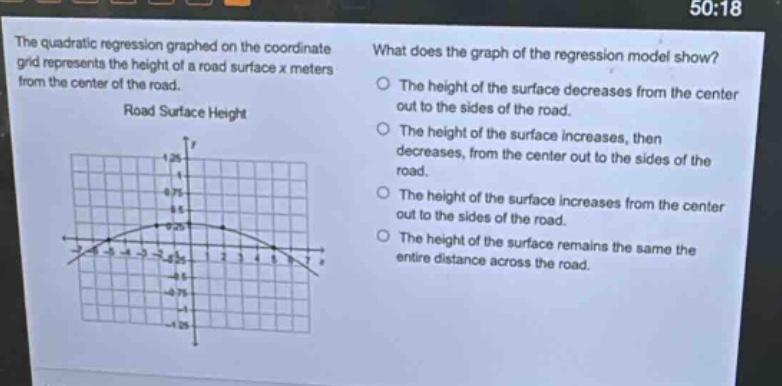
the quadratic regression graphed on the coordinate grid represents the height of a road surface x meters from the center of the road. road surface height what does the graph of the regression model show? the height of the surface decreases from the center out to the sides of the road. the height of the surface increases, then decreases, from the center out to the sides of the road. the height of the surface increases from the center out to the sides of the road. the height of the surface remains the same the entire distance across the road.
Answer
Brief Explanations:
Examine the quadratic - regression graph. The x - axis represents distance from the center of the road and the y - axis represents height. As we move from the center (x = 0) to the sides (increasing x - values), the y - values (height) decrease.
Answer:
The height of the surface decreases from the center out to the sides of the road.