question 15\nthe scatter plot shows the temperature in degrees fahrenheit (y), recorded on a day at various…
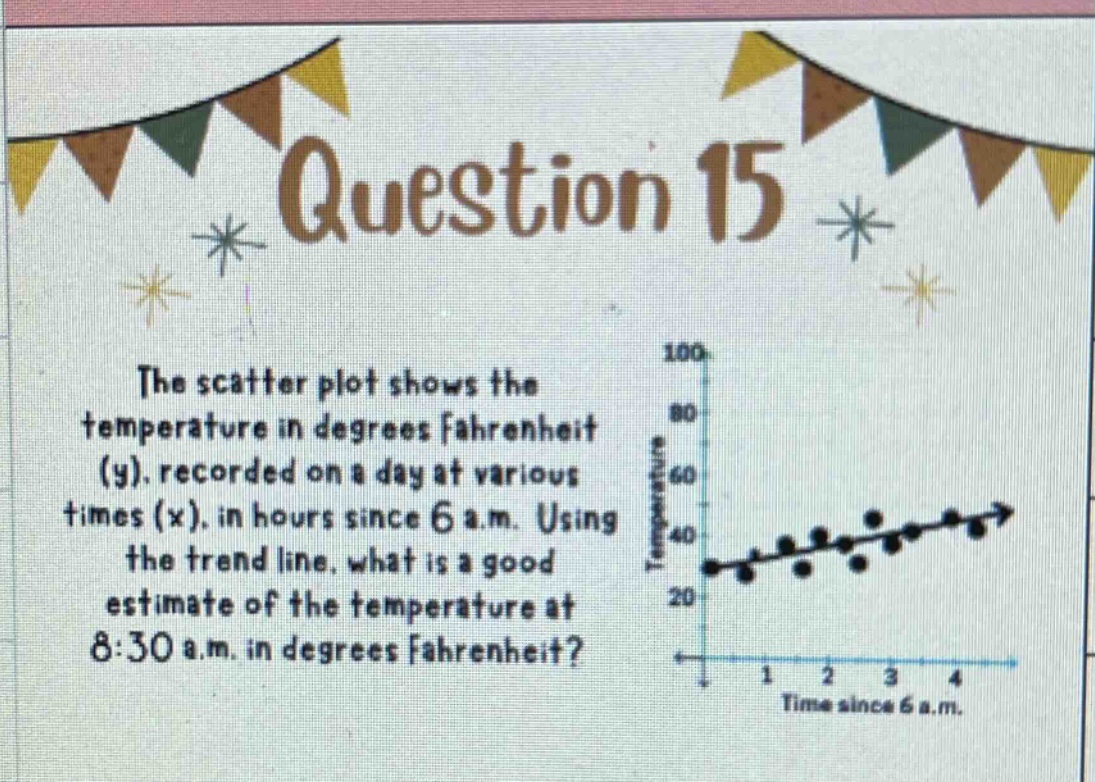
question 15\nthe scatter plot shows the temperature in degrees fahrenheit (y), recorded on a day at various times (x), in hours since 6 a.m. using the trend line, what is a good estimate of the temperature at 8:30 a.m. in degrees fahrenheit?
Answer
Explanation:
Step1: Calculate time - interval
The time from 6 a.m. to 8:30 a.m. is 2.5 hours, so (x = 2.5).
Step2: Estimate from the trend - line
By looking at the trend - line of the scatter - plot, when (x = 2.5), we estimate the value of (y) (temperature). Visually, the temperature (y) is around 45 degrees Fahrenheit.
Answer:
45