question 4 of 15\nthe table shows the colors of the cars sold from a dealership over the last month.\ncolor…
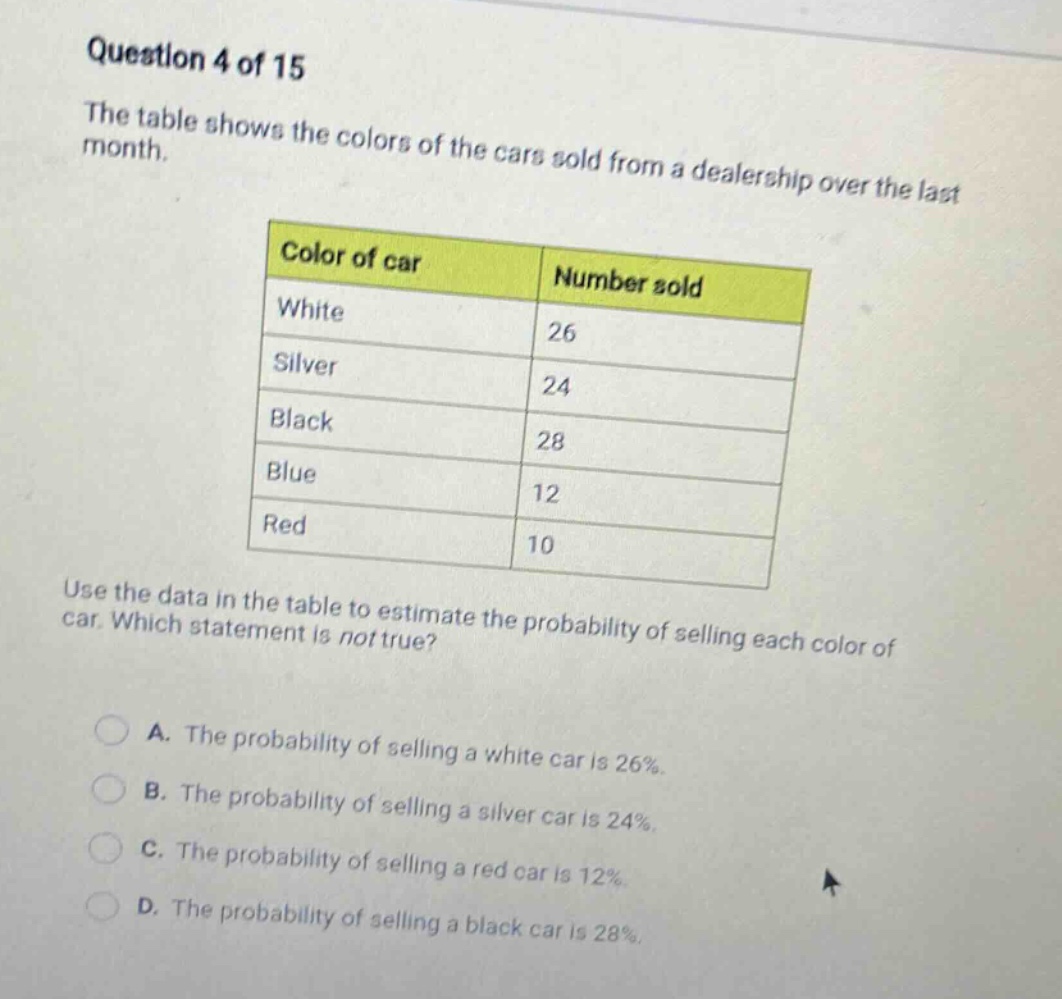
question 4 of 15\nthe table shows the colors of the cars sold from a dealership over the last month.\ncolor of car number sold\nwhite 26\nsilver 24\nblack 28\nblue 12\nred 10\nuse the data in the table to estimate the probability of selling each color of car. which statement is not true?\na. the probability of selling a white car is 26%.\nb. the probability of selling a silver car is 24%.\nc. the probability of selling a red car is 12%.\nd. the probability of selling a black car is 28%.
Answer
Explanation:
Step1: Calculate total number of cars sold
$26 + 24+28 + 12+10=100$
Step2: Calculate probability of selling each color
- Probability of white: $\frac{26}{100}=0.26 = 26%$
- Probability of silver: $\frac{24}{100}=0.24 = 24%$
- Probability of black: $\frac{28}{100}=0.28 = 28%$
- Probability of blue: $\frac{12}{100}=0.12 = 12%$
- Probability of red: $\frac{10}{100}=0.10 = 10%$
Answer:
C. The probability of selling a red car is 12%.