question 6 of 20\nif the data are reorganized into a new histogram with ranges of 4 instead of 2, which…
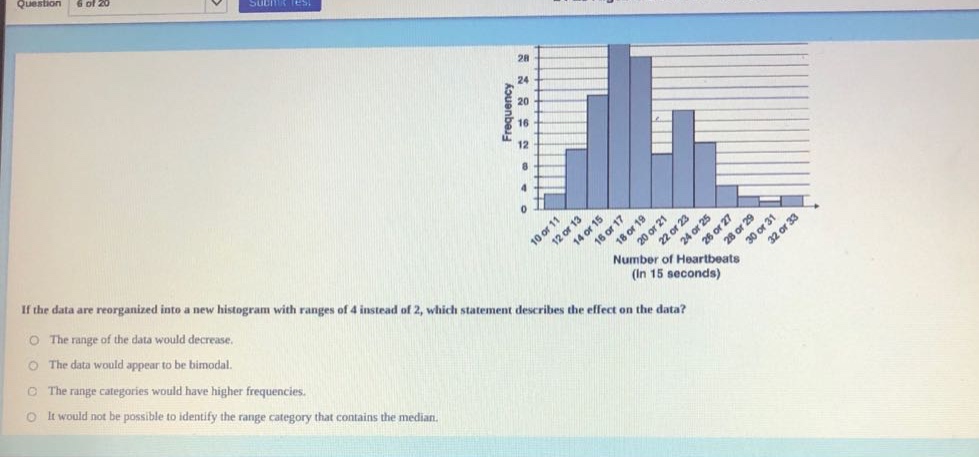
question 6 of 20\nif the data are reorganized into a new histogram with ranges of 4 instead of 2, which statement describes the effect on the data?\nthe range of the data would decrease.\nthe data would appear to be bimodal.\nthe range categories would have higher frequencies.\nit would not be possible to identify the range category that contains the median.
Answer
Explanation:
Step1: Understand range concept
The range of a data - set is the difference between the maximum and minimum values. Changing the bin width in a histogram does not change the actual data values, so the range of the data remains the same. So, the statement "The range of the data would decrease" is false.
Step2: Analyze modality
Changing the bin width can change the appearance of the modality of the data. But without knowing the exact data values, we cannot be sure that the data would appear to be bimodal just by changing the bin width from 2 to 4.
Step3: Consider frequency in new bins
When we combine adjacent bins (from bin - width 2 to bin - width 4), the frequencies of the new, wider bins will be the sum of the frequencies of the combined narrower bins. So, the range categories (new bins) will have higher frequencies.
Step4: Analyze median identification
We can still identify the range category that contains the median. We just need to re - calculate the cumulative frequencies based on the new bin widths.
Answer:
The range categories would have higher frequencies.