question 6\nthe bar graph shows the results of 200 experiments. each experiment involved one person rolling…
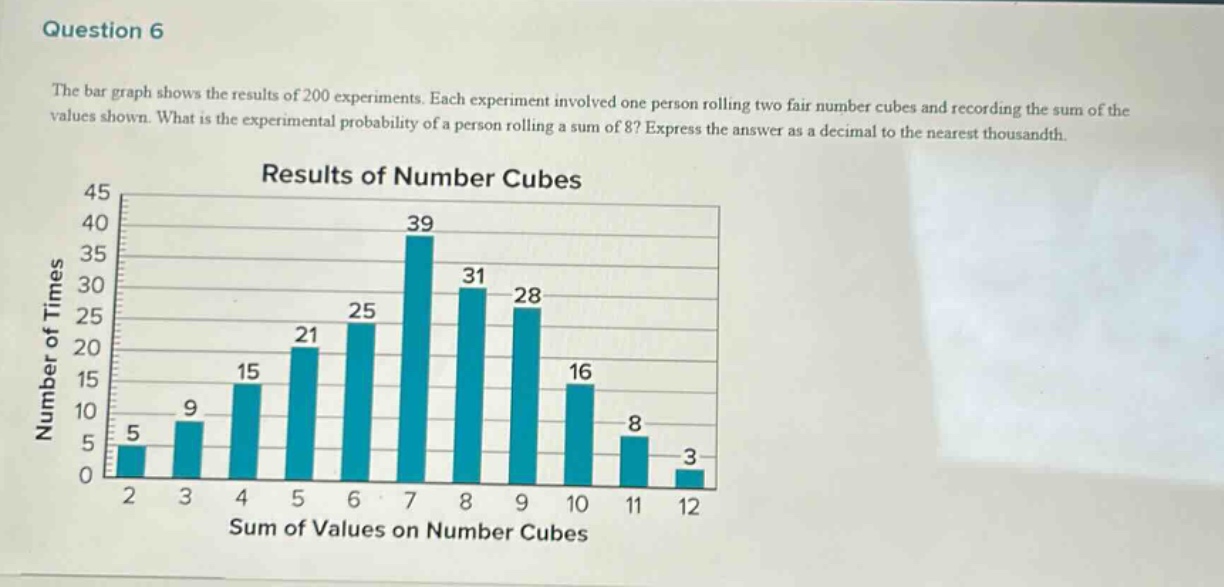
question 6\nthe bar graph shows the results of 200 experiments. each experiment involved one person rolling two fair number cubes and recording the sum of the values shown. what is the experimental probability of a person rolling a sum of 8? express the answer as a decimal to the nearest thousandth.\nresults of number cubes\nsum of values on number cubes
Answer
Explanation:
Step1: Identify relevant data
The total number of experiments is 200. The number of times the sum of 8 was rolled is 31.
Step2: Calculate experimental - probability
The formula for experimental probability $P$ is $P=\frac{\text{Number of favorable outcomes}}{\text{Total number of outcomes}}$. So, $P=\frac{31}{200}$.
Step3: Convert to decimal
$\frac{31}{200}=0.155$
Answer:
0.155