question\nthe box plot below represents some data set. what is the interquartile range (iqr) of the…
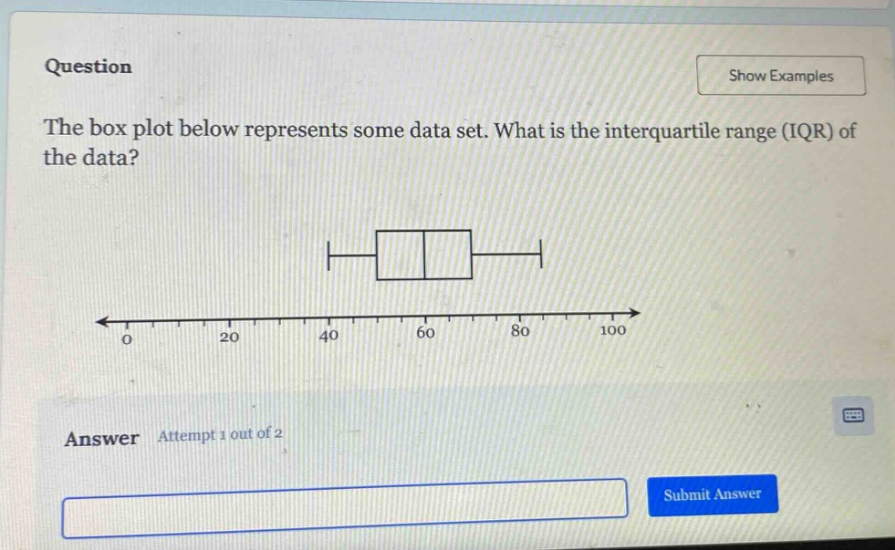
question\nthe box plot below represents some data set. what is the interquartile range (iqr) of the data?\nanswer attempt 1 out of 2\nsubmit answer
Answer
Explanation:
Step1: Identify Q1 and Q3
In a box - plot, the left - hand side of the box is Q1 and the right - hand side of the box is Q3. From the box - plot, Q1 = 40 and Q3 = 80.
Step2: Calculate the IQR
The inter - quartile range (IQR) is calculated as IQR=Q3 - Q1. Substitute Q1 = 40 and Q3 = 80 into the formula: IQR = 80 - 40.
Answer:
40