question\nthe box plot below represents some data set. what is the range of the data?
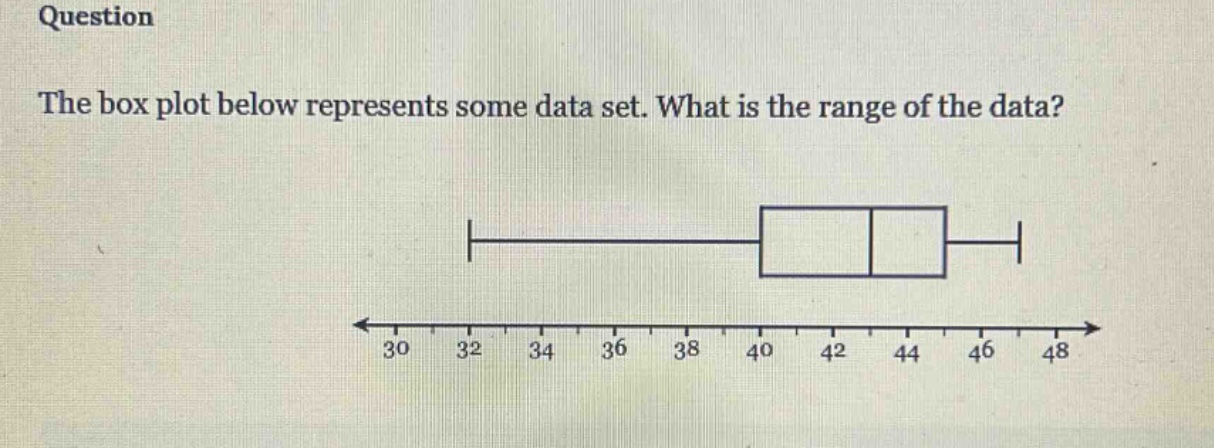
question\nthe box plot below represents some data set. what is the range of the data?
Answer
Explanation:
Step1: Identify min and max values
The minimum value of the data - set from the box - plot is 30 and the maximum value is 48.
Step2: Calculate the range
The formula for the range of a data - set is $Range = Max - Min$. So, $Range=48 - 30$.
Answer:
18