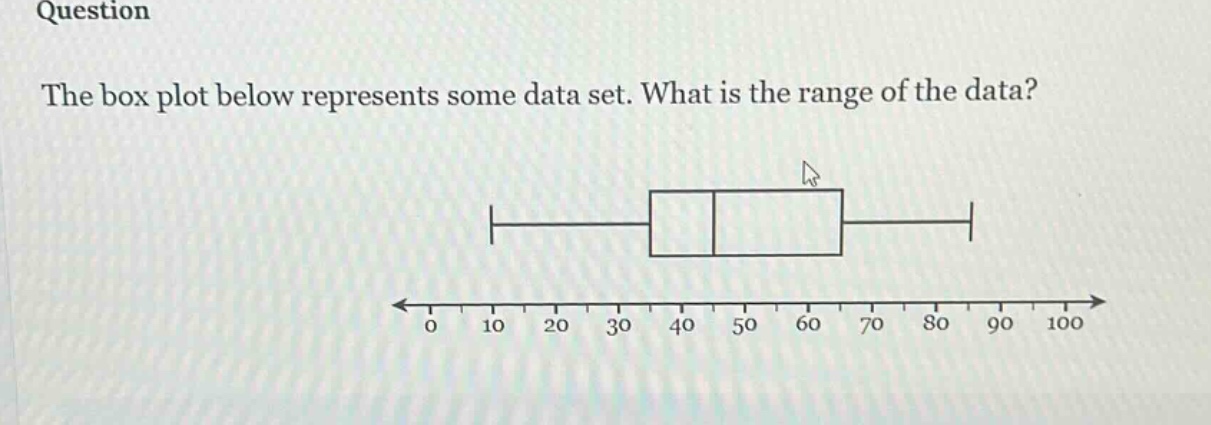
question the box plot below represents some data set. what is the range of the data?
question the box plot below represents some data set. what is the range of the data?
Answer
Explanation:
Step1: Recall range formula
The range of a data - set is given by $Range = \text{Maximum value}-\text{Minimum value}$.
Step2: Identify maximum and minimum
From the box - plot, the minimum value is 0 and the maximum value is 90.
Step3: Calculate the range
$Range=90 - 0=90$.
Answer:
90