question\nthe box plot below represents some data set. what is the range of the data?\nanswer attempt 1 out…
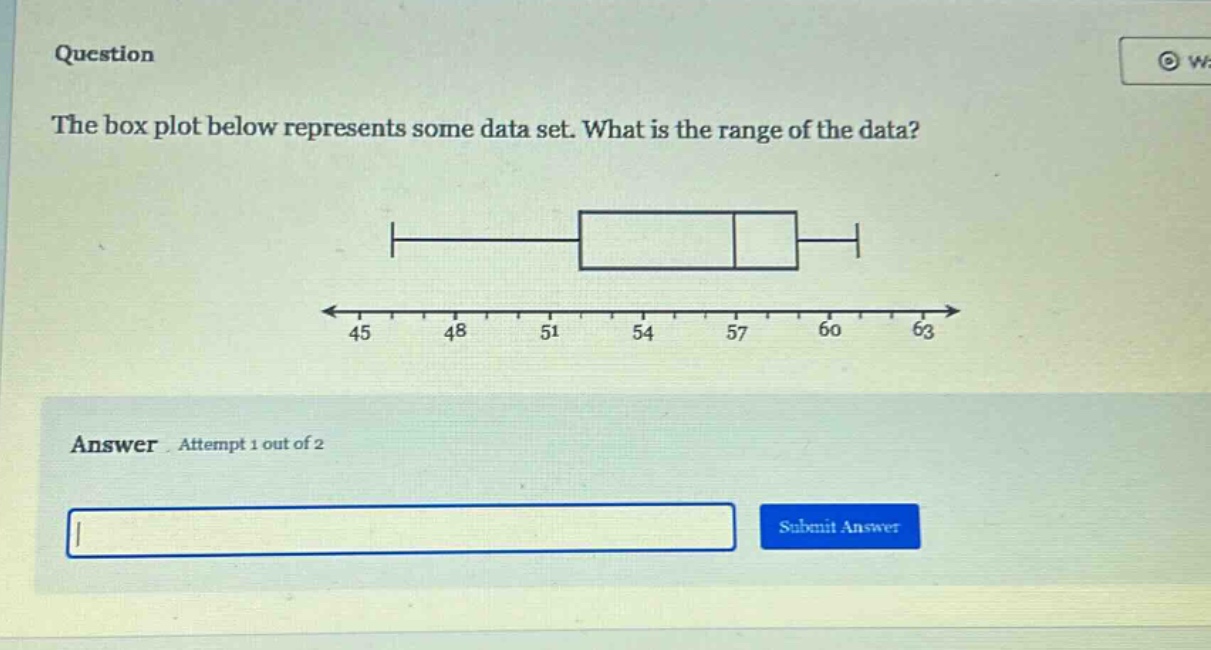
question\nthe box plot below represents some data set. what is the range of the data?\nanswer attempt 1 out of 2
Answer
Explanation:
Step1: Identify maximum and minimum
The minimum value of the data - set from the box - plot is 45 and the maximum value is 63.
Step2: Calculate the range
The formula for the range of a data - set is $Range = Maximum - Minimum$. So, $Range=63 - 45$. $Range = 18$
Answer:
18