question\nthe box - and - whisker plot below represents some data set. what is the range of the data?
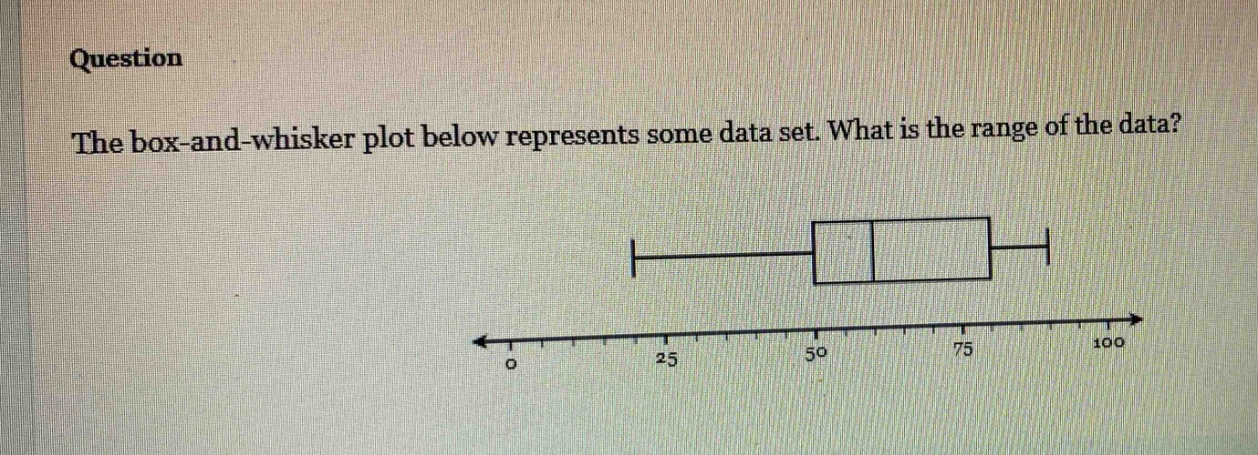
question\nthe box - and - whisker plot below represents some data set. what is the range of the data?
Answer
Explanation:
Step1: Identificar valor máximo
El valor máximo en el diagrama de caja y bigotes es 100.
Step2: Identificar valor mínimo
El valor mínimo en el diagrama de caja y bigotes es 10.
Step3: Calcular el rango
El rango se calcula restando el valor mínimo del valor máximo. Entonces, $rango = 100 - 10$. $rango=90$
Answer:
90