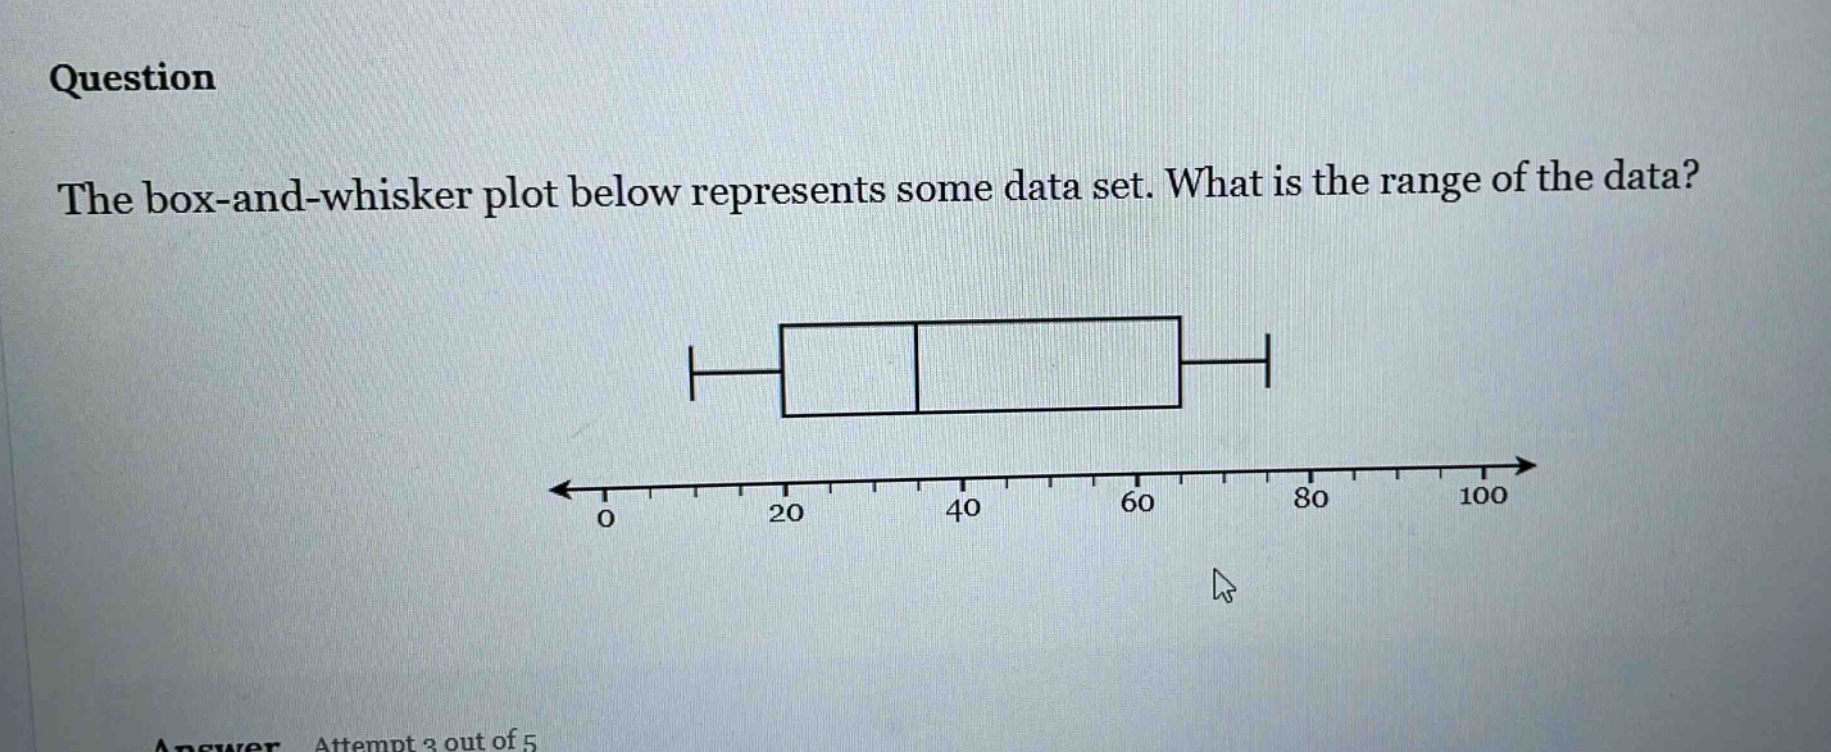
question the box - and - whisker plot below represents some data set. what is the range of the data?
question the box - and - whisker plot below represents some data set. what is the range of the data?
Answer
Answer:
80
Explanation:
Step1: Identify min - max values
The minimum value of the data set from the box - and - whisker plot is 10 and the maximum value is 90.
Step2: Calculate the range
Range = Max - Min = 90 - 10 = 80