question the box - and - whisker plot below represents some data set. what is the range of the data? answer…
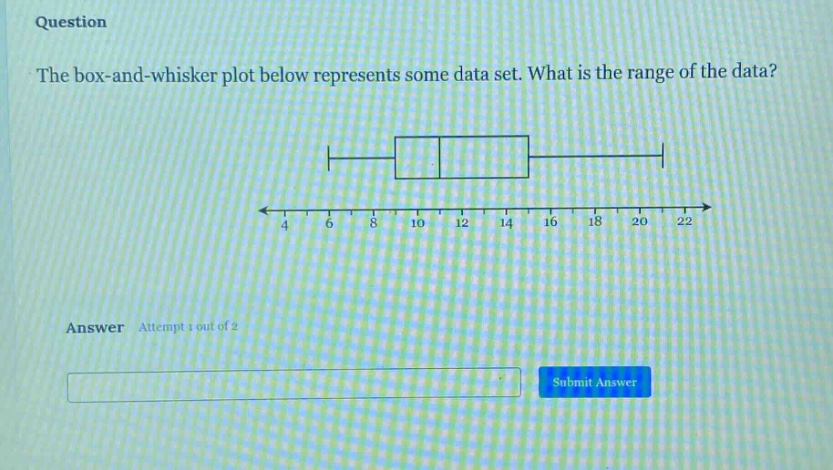
question the box - and - whisker plot below represents some data set. what is the range of the data? answer attempt 1 out of 2 submit answer
Answer
Explanation:
Step1: Identify minimum value
The minimum value in a box - and - whisker plot is the end of the left - most whisker. Here, the minimum value is 4.
Step2: Identify maximum value
The maximum value in a box - and - whisker plot is the end of the right - most whisker. Here, the maximum value is 22.
Step3: Calculate the range
The range is calculated as the difference between the maximum and minimum values. So, range = maximum - minimum = 22 - 4. $22-4 = 18$
Answer:
18