question\ndescribe the association in the scatter plot below.\nanswer attempt 1 out of 2\nthe scatter plot…
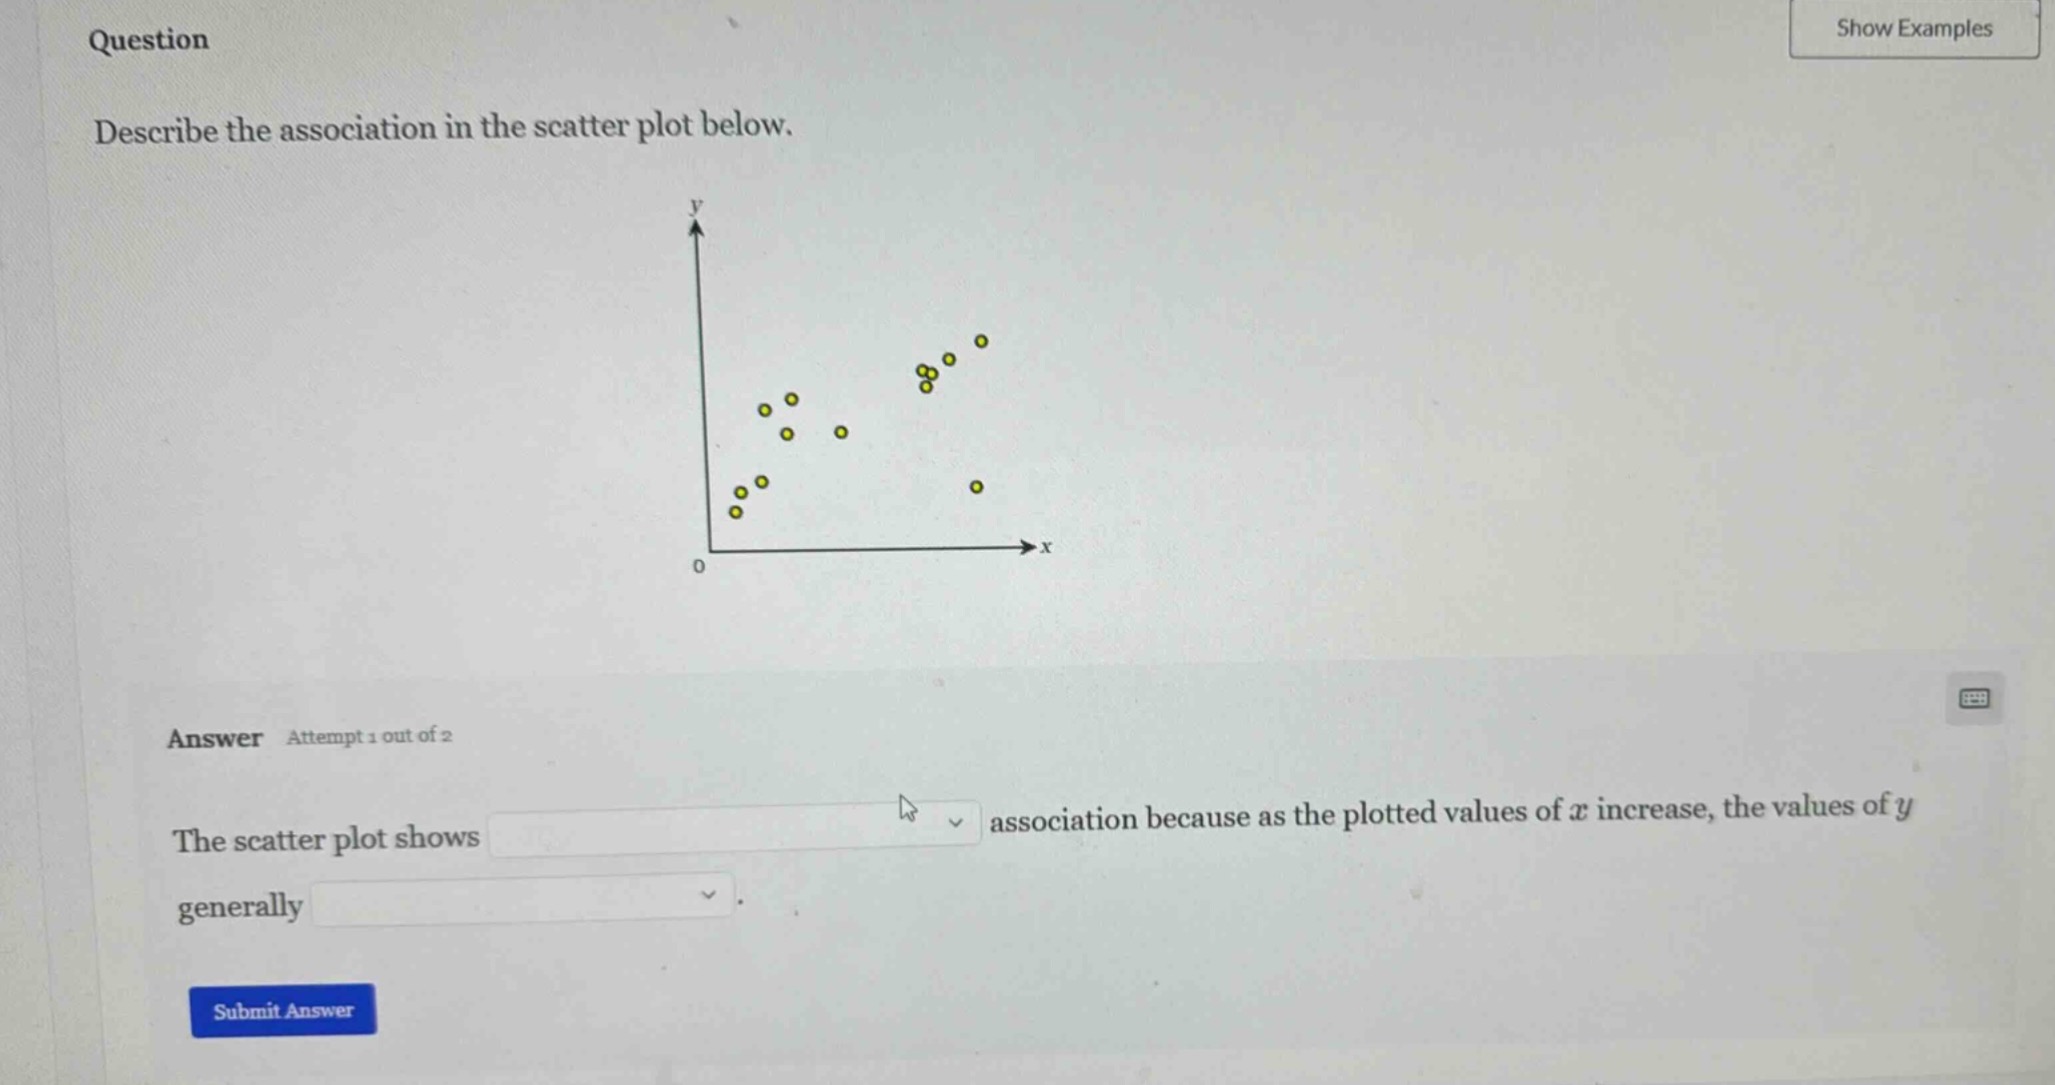
question\ndescribe the association in the scatter plot below.\nanswer attempt 1 out of 2\nthe scatter plot shows \nassociation because as the plotted values of ( x ) increase, the values of ( y ) generally \n.
Answer
Brief Explanations:
To describe the association in a scatter plot, we analyze the direction of the relationship between ( x ) and ( y ). If as ( x ) increases, ( y ) tends to increase, it's a positive association; if ( y ) tends to decrease, it's negative. Here, observing the scatter plot, as ( x ) (horizontal axis) values increase, the ( y ) (vertical axis) values generally trend upward, indicating a positive association. The first dropdown should be "positive" (since the trend is upward) and the second dropdown should be "increase" (because ( y ) values go up with ( x ) increase).
Answer:
The scatter plot shows (\boldsymbol{\text{positive}}) association because as the plotted values of ( x ) increase, the values of ( y ) generally (\boldsymbol{\text{increase}}).