which question would generate data that could best be represented in a circle graph?\nwhat is the height of…
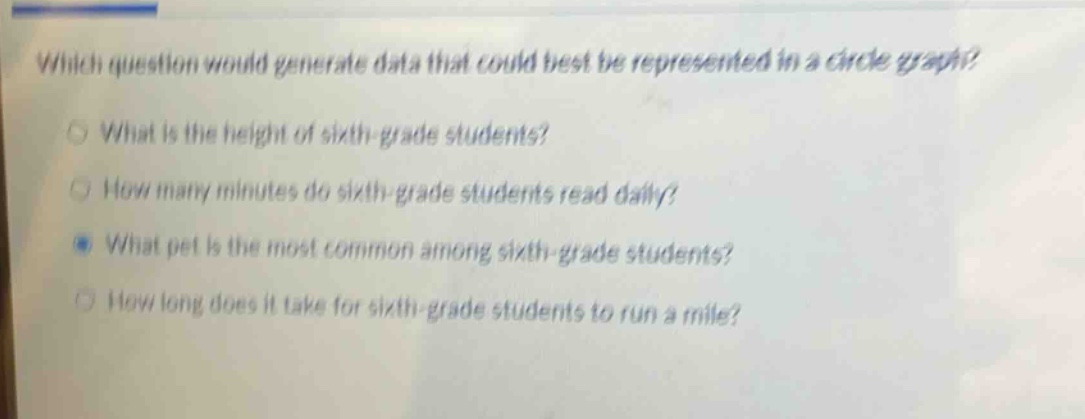
which question would generate data that could best be represented in a circle graph?\nwhat is the height of sixth - grade students?\nhow many minutes do sixth - grade students read daily?\nwhat pet is the most common among sixth - grade students?\nhow long does it take for sixth - grade students to run a mile?
Answer
Brief Explanations:
A circle - graph is best for showing parts of a whole or percentages of different categories. The question about the most common pet among sixth - grade students has distinct categories (types of pets) whose proportions can be shown as parts of a whole in a circle graph. The other questions deal with numerical data (height, time of reading, time to run a mile) which are better represented by other types of graphs like histograms or line graphs.
Answer:
What pet is the most common among sixth - grade students?