question 6\nthe scores from a recent quiz were 9, 6, 7, 7, 8, 9, 5, 6, 3, 8, 7, 9, 5, 8, 9, and 10. which…
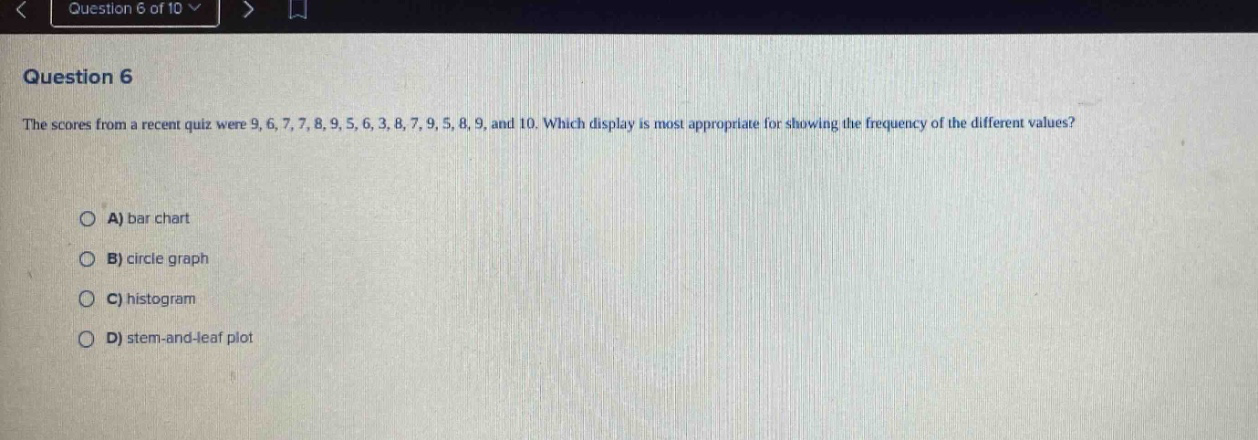
question 6\nthe scores from a recent quiz were 9, 6, 7, 7, 8, 9, 5, 6, 3, 8, 7, 9, 5, 8, 9, and 10. which display is most appropriate for showing the frequency of the different values?\na) bar chart\nb) circle graph\nc) histogram\nd) stem - and - leaf plot
Answer
Brief Explanations:
A bar - chart is best for showing the frequency of distinct values. A circle graph is for showing proportions of a whole. A histogram is for grouped data intervals. A stem - and - leaf plot shows the distribution of data but not as straightforwardly for frequency as a bar chart.
Answer:
A. bar chart