question 1 of 5\nselect all the correct answers.\nwhich data sets could be used to create the box plot…
question 1 of 5\nselect all the correct answers.\nwhich data sets could be used to create the box plot below?\n□ 7,9,11,1,6,7,14,8\n□ 6,8,11,1,7,14,10\n□ 14,10,6,9,11,8,1\n□ 10,6,9,14,1,6,12,7\n□ 4,11,8,12,1,6,14
Answer
Explanation:
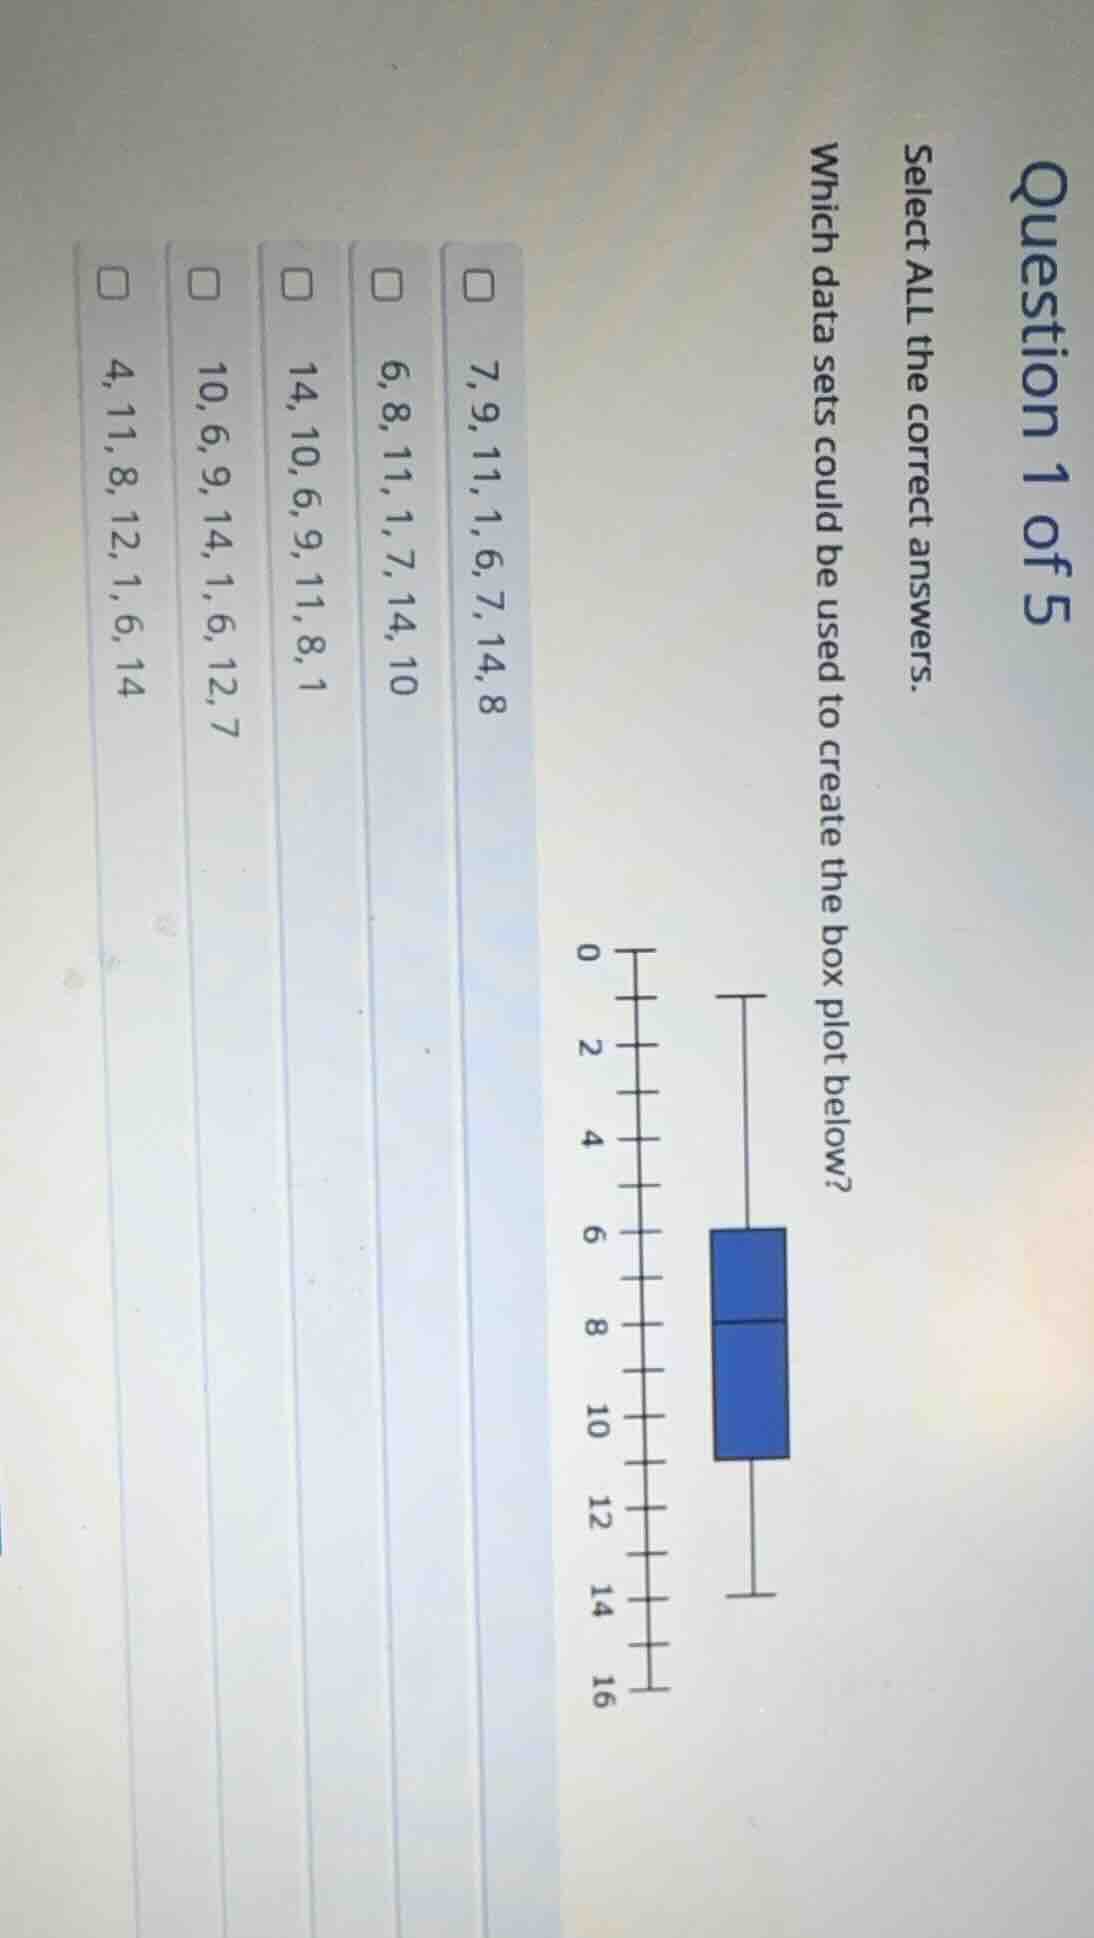
Step1: Identify box plot values
Min = 1, Q1 = 6, Median = 8, Q3 = 11, Max = 14
Step2: Check Dataset 1
Sort: $1, 6, 7, 7, 8, 9, 11, 14$ Min=1, Q1=$\frac{6+7}{2}=6.5$, Median=$\frac{7+8}{2}=7.5$, Q3=$\frac{9+11}{2}=10$, Max=14 → Does not match.
Step3: Check Dataset 2
Sort: $1, 6, 7, 8, 10, 11, 14$ Min=1, Q1=6, Median=8, Q3=11, Max=14 → Matches.
Step4: Check Dataset 3
Sort: $1, 6, 8, 9, 10, 11, 14$ Min=1, Q1=6, Median=9, Q3=11, Max=14 → Median does not match.
Step5: Check Dataset 4
Sort: $1, 6, 7, 9, 10, 12, 14$ Min=1, Q1=6, Median=9, Q3=12, Max=14 → Median/Q3 do not match.
Step6: Check Dataset 5
Sort: $1, 4, 6, 8, 11, 12, 14$ Min=1, Q1=4, Median=8, Q3=11, Max=14 → Q1 does not match.
Answer:
6, 8, 11, 1, 7, 14, 10