this question has two parts. a student computed the correlation coefficient, r, for a set of data. the…
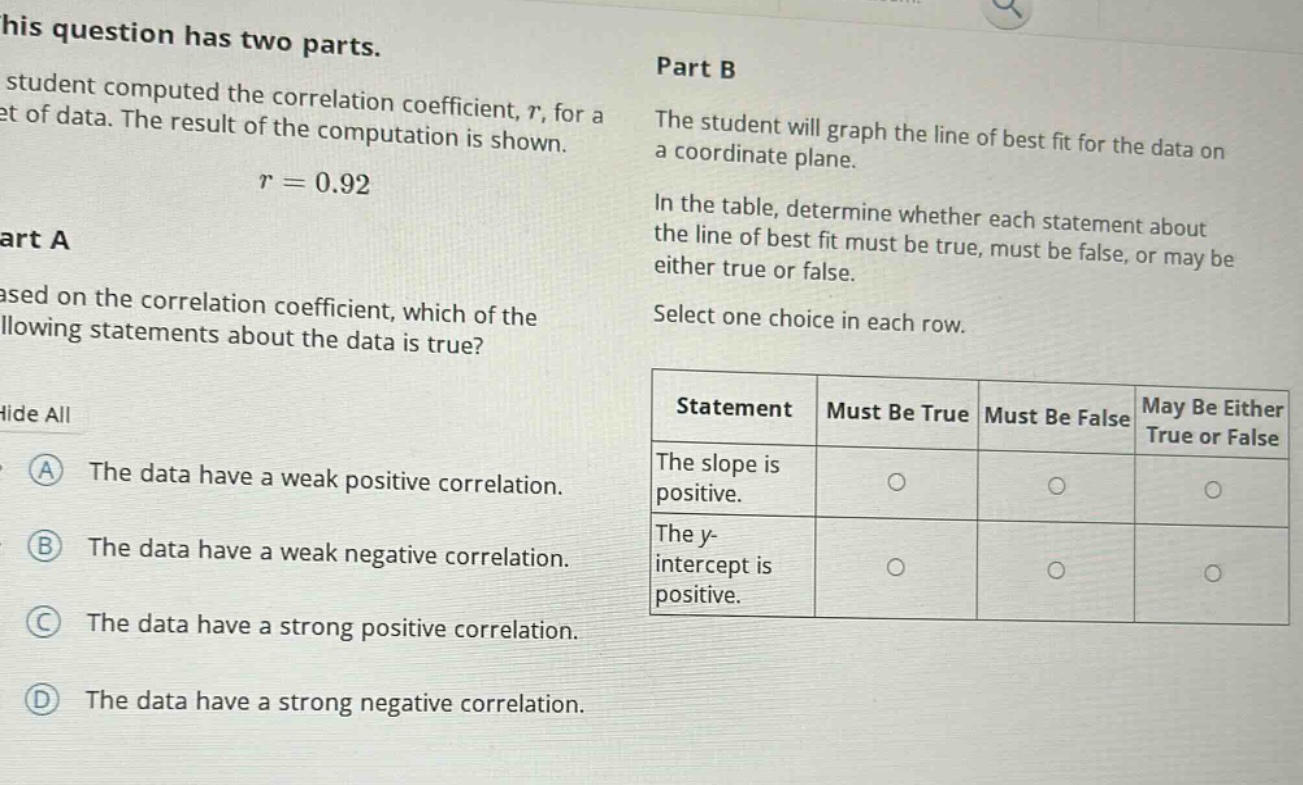
this question has two parts. a student computed the correlation coefficient, r, for a set of data. the result of the computation is shown. r = 0.92 part a based on the correlation coefficient, which of the following statements about the data is true? hide all a the data have a weak positive correlation. b the data have a weak negative correlation. c the data have a strong positive correlation. d the data have a strong negative correlation. part b the student will graph the line of best fit for the data on a coordinate plane. in the table, determine whether each statement about the line of best fit must be true, must be false, or may be either true or false. select one choice in each row. statement must be true must be false may be either true or false the slope is positive. the y - intercept is positive.
Answer
Answer:
Part A:
C. The data have a strong positive correlation.
Part B:
| Statement | Must Be True | Must Be False | May Be Either True or False |
|---|---|---|---|
| The slope is positive. | O | O | |
| The y - intercept is positive. | O |
Explanation:
Step1: Understand correlation coefficient range
The correlation coefficient $r$ ranges from - 1 to 1. Values close to 1 indicate a strong positive correlation, values close to - 1 indicate a strong negative correlation, and values close to 0 indicate a weak correlation. Since $r = 0.92$ which is close to 1, it's a strong positive correlation for Part A.
Step2: Analyze slope for positive correlation
For a positive correlation, the line of best - fit has a positive slope. So the statement "The slope is positive" must be true.
Step3: Analyze y - intercept
The sign of the y - intercept has no direct relation to the sign or strength of the correlation coefficient. So the statement "The y - intercept is positive" may be either true or false.