question 8 of 9\nuse the given data to make a box-and-whisker plot.\n8, 9, 5, 15, 12, 25, 4
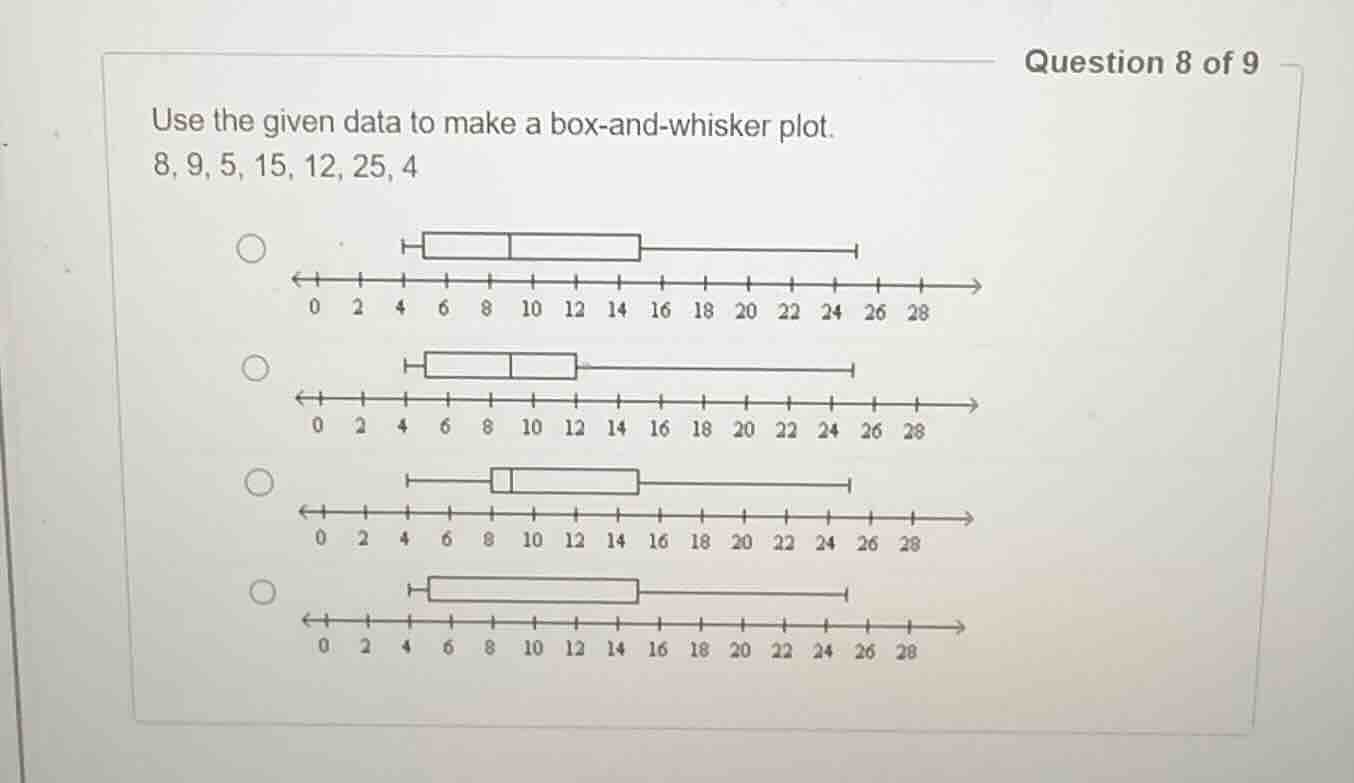
question 8 of 9\nuse the given data to make a box-and-whisker plot.\n8, 9, 5, 15, 12, 25, 4
Answer
Explanation:
Step1: Sort the data set
Sorted data: $4, 5, 8, 9, 12, 15, 25$
Step2: Find minimum value
Minimum = $4$
Step3: Find maximum value
Maximum = $25$
Step4: Calculate median (Q2)
Median is the 4th value: $9$
Step5: Calculate Q1 (lower median)
Lower half: $4, 5, 8$; Q1 = $5$
Step6: Calculate Q3 (upper median)
Upper half: $12, 15, 25$; Q3 = $15$
Step7: Match to box plot
Box plot has whiskers at 4 and 25, box edges at 5 and 15, median line at 9.
Answer:
The correct box-and-whisker plot is the first option (topmost plot, with left whisker at 4, left box edge at 5, median line at 9, right box edge at 15, right whisker at 25).