randomly selected seniors and freshmen from four different schools were surveyed as to whether they…
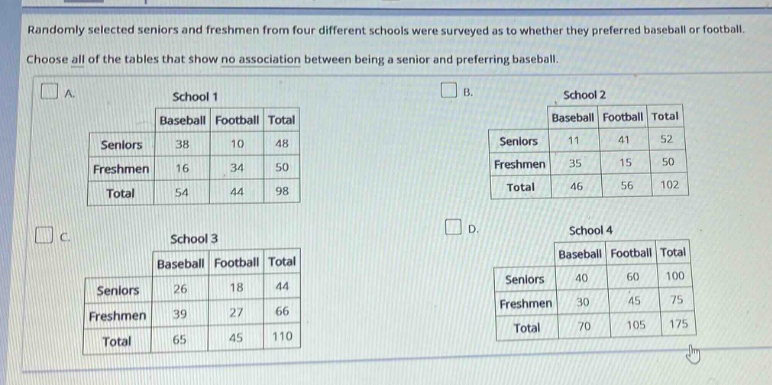
randomly selected seniors and freshmen from four different schools were surveyed as to whether they preferred baseball or football. choose all of the tables that show no association between being a senior and preferring baseball.\na. school 1\n| |baseball|football|total|\n|--|--|--|--|\n|seniors|38|10|48|\n|freshmen|16|34|50|\n|total|54|44|98|\nb. school 2\n| |baseball|football|total|\n|--|--|--|--|\n|seniors|11|41|52|\n|freshmen|35|15|50|\n|total|46|56|102|\nc. school 3\n| |baseball|football|total|\n|--|--|--|--|\n|seniors|26|18|44|\n|freshmen|39|27|66|\n|total|65|45|110|\nd. school 4\n| |baseball|football|total|\n|--|--|--|--|\n|seniors|40|60|100|\n|freshmen|30|45|75|\n|total|70|105|175|
Answer
Explanation:
Step1: Recall the concept of no - association
If there is no association between being a senior and preferring baseball, then the proportion of seniors who prefer baseball should be approximately equal to the proportion of freshmen who prefer baseball. That is, $\frac{\text{Number of senior baseball - lovers}}{\text{Total number of seniors}}\approx\frac{\text{Number of freshman baseball - lovers}}{\text{Total number of freshmen}}$.
Step2: Analyze Table A
For Table A: The proportion of seniors who prefer baseball is $\frac{38}{48}\approx0.792$. The proportion of freshmen who prefer baseball is $\frac{16}{50} = 0.32$. Since $0.792\neq0.32$, there is an association.
Step3: Analyze Table B
For Table B: The proportion of seniors who prefer baseball is $\frac{11}{52}\approx0.212$. The proportion of freshmen who prefer baseball is $\frac{35}{50}=0.7$. Since $0.212\neq0.7$, there is an association.
Step4: Analyze Table C
For Table C: The proportion of seniors who prefer baseball is $\frac{26}{44}\approx0.591$. The proportion of freshmen who prefer baseball is $\frac{39}{66}\approx0.591$. Since the two proportions are approximately equal, there is no association.
Step5: Analyze Table D
For Table D: The proportion of seniors who prefer baseball is $\frac{40}{100} = 0.4$. The proportion of freshmen who prefer baseball is $\frac{30}{75}=0.4$. Since the two proportions are equal, there is no association.
Answer:
C. School 3, D. School 4