raquel and van live in two different cities. as part of a project, they each record the lowest prices for a…
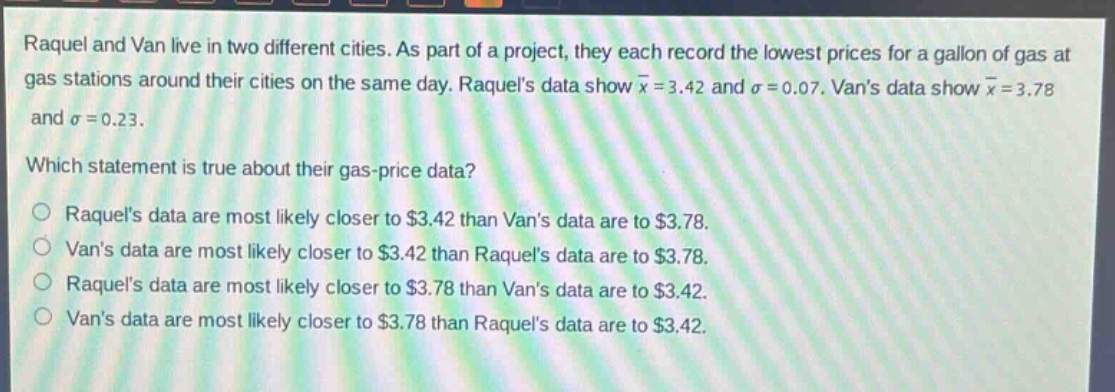
raquel and van live in two different cities. as part of a project, they each record the lowest prices for a gallon of gas at gas stations around their cities on the same day. raquels data show $\bar{x}=3.42$ and $sigma = 0.07$. vans data show $\bar{x}=3.78$ and $sigma=0.23$. which statement is true about their gas - price data? raquels data are most likely closer to $3.42 than vans data are to $3.78. vans data are most likely closer to $3.42 than raquels data are to $3.78. raquels data are most likely closer to $3.78 than vans data are to $3.42. vans data are most likely closer to $3.78 than raquels data are to $3.42.
Answer
Answer:
A. Raquel's data are most likely closer to $3.42 than Van's data are to $3.78.
Explanation:
Step1: Understand standard - deviation concept
Standard - deviation ($\sigma$) measures the amount of variation or dispersion of a set of values. A low standard - deviation indicates that the data points tend to be close to the mean ($\bar{x}$), while a high standard - deviation indicates that the data points are spread out over a wider range of values.
Step2: Analyze Raquel's data
Raquel has a mean $\bar{x}_R = 3.42$ and standard - deviation $\sigma_R=0.07$. A small standard - deviation of 0.07 means her data points are likely to be close to the mean of 3.42.
Step3: Analyze Van's data
Van has a mean $\bar{x}_V = 3.78$ and standard - deviation $\sigma_V = 0.23$. A larger standard - deviation of 0.23 means his data points are more spread out and less likely to be close to the mean of 3.78 compared to Raquel's data being close to her mean.