read the directions for creating a histogram.\n1. label the x - axis and choose the interval.\n2. calculate…
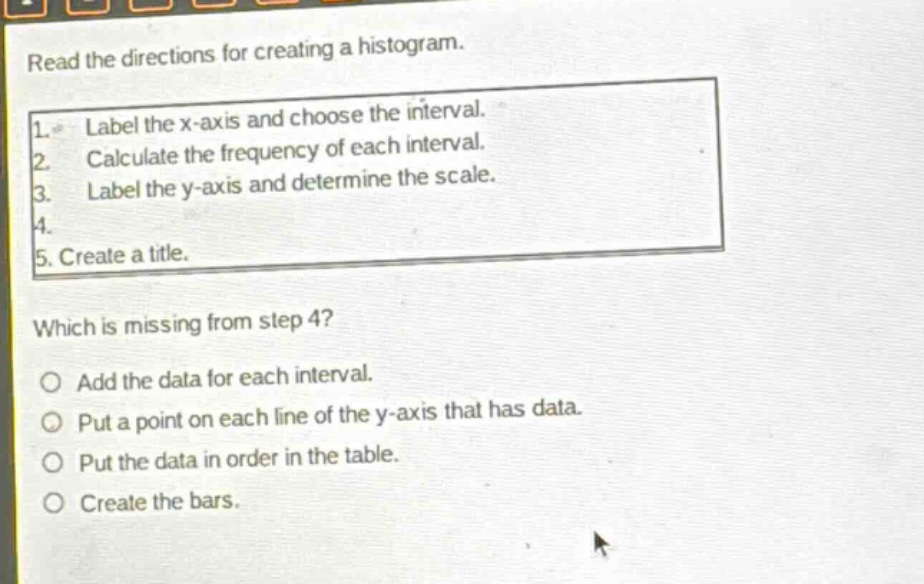
read the directions for creating a histogram.\n1. label the x - axis and choose the interval.\n2. calculate the frequency of each interval.\n3. label the y - axis and determine the scale.\n4.\n5. create a title.\nwhich is missing from step 4?\no add the data for each interval.\no put a point on each line of the y - axis that has data.\no put the data in order in the table.\no create the bars.
Answer
Brief Explanations:
When creating a histogram, after creating a title, the next step is to create the bars to represent the data frequencies for each interval. The other options are not the logical next - step after creating a title.
Answer:
Create the bars.