read each relationship and decide whether its graph would be continuous or discrete.\nnumber of students per…
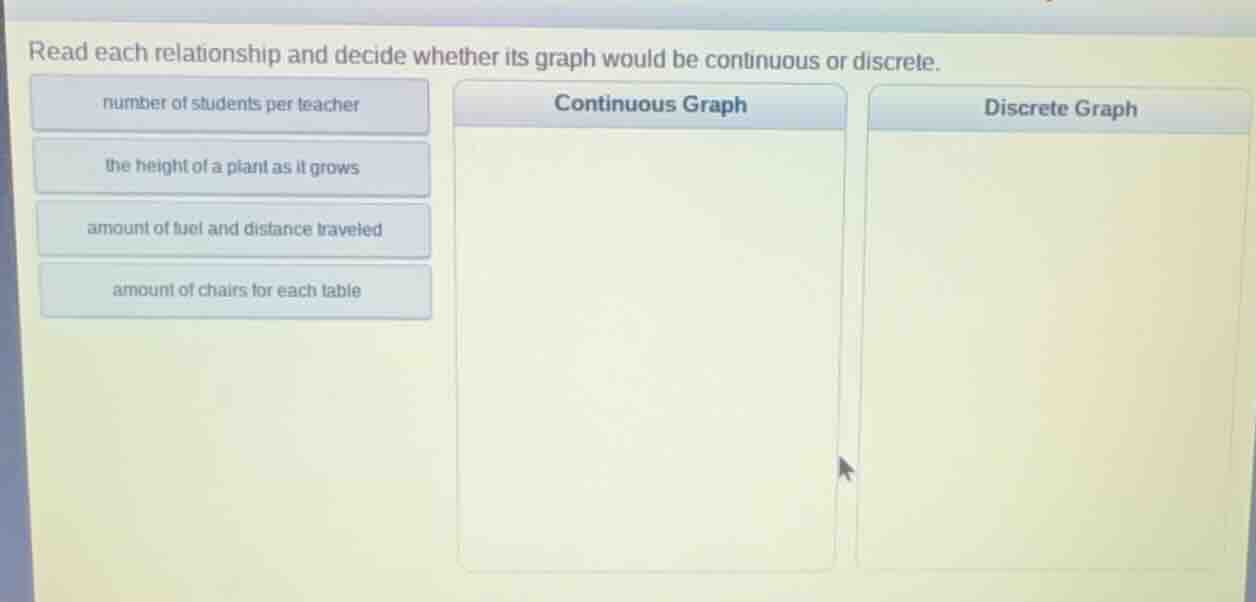
read each relationship and decide whether its graph would be continuous or discrete.\nnumber of students per teacher\nthe height of a plant as it grows\namount of fuel and distance traveled\namount of chairs for each table\ncontinuous graph\ndiscrete graph
Answer
Brief Explanations:
- Continuous graphs represent data that can take any value within a range (measurable, non-countable in distinct steps).
- Discrete graphs represent data that can only take specific, separate values (countable whole units).
- Number of students per teacher: Students are whole, countable units—you can't have a fraction of a student, so this is discrete.
- The height of a plant as it grows: Height can take any value (e.g., 5.2 cm, 5.23 cm) and changes smoothly, so this is continuous.
- Amount of fuel and distance traveled: Fuel amount and distance can take any value (e.g., 2.3 gallons, 10.7 miles) and change gradually, so this is continuous.
- Amount of chairs for each table: Chairs are whole, countable units—you can't have a fraction of a chair, so this is discrete.
Answer:
Continuous Graph:
- the height of a plant as it grows
- amount of fuel and distance traveled
Discrete Graph:
- number of students per teacher
- amount of chairs for each table