a real number between 1 and 11 will be picked according to the probability distribution shown in the figure…
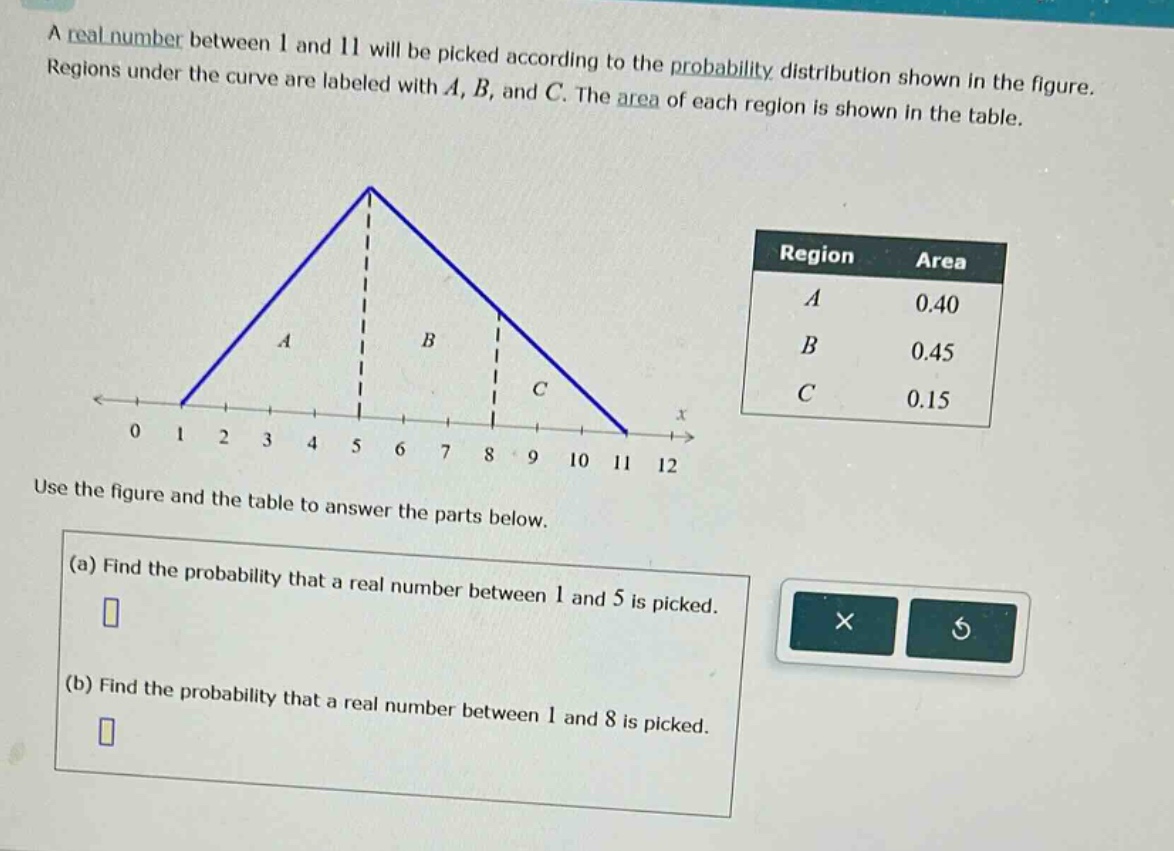
a real number between 1 and 11 will be picked according to the probability distribution shown in the figure. regions under the curve are labeled with a, b, and c. the area of each region is shown in the table. use the figure and the table to answer the parts below. (a) find the probability that a real number between 1 and 5 is picked. (b) find the probability that a real number between 1 and 8 is picked.
Answer
Answer:
(a) 0.40 (b) 0.85
Explanation:
Step1: Identify relevant regions for (a)
Region A corresponds to numbers between 1 and 5.
Step2: Determine probability for (a)
The area of region A is 0.40, so probability is 0.40.
Step3: Identify relevant regions for (b)
Regions A and B correspond to numbers between 1 and 8.
Step4: Calculate probability for (b)
Add areas of A and B: $0.40 + 0.45=0.85$.