in a recent survey, students were asked how long they play video games in one sitting. the interquartile…
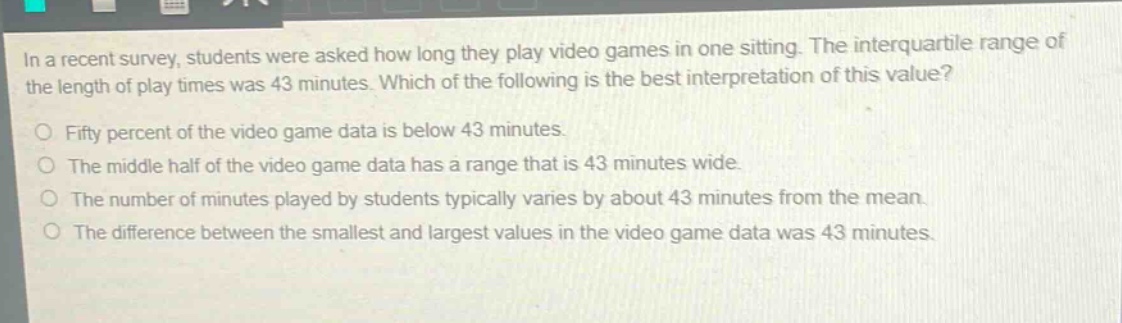
in a recent survey, students were asked how long they play video games in one sitting. the interquartile range of the length of play times was 43 minutes. which of the following is the best interpretation of this value?\nfifty percent of the video game data is below 43 minutes.\nthe middle half of the video game data has a range that is 43 minutes wide.\nthe number of minutes played by students typically varies by about 43 minutes from the mean.\nthe difference between the smallest and largest values in the video game data was 43 minutes.
Answer
Explanation:
Step1: Recall inter - quartile range definition
The inter - quartile range (IQR) is the difference between the third quartile ($Q_3$) and the first quartile ($Q_1$), i.e., $IQR = Q_3 - Q_1$. It represents the range of the middle 50% of the data.
Step2: Analyze each option
- Option 1: Fifty percent of the data is below the median, not related to IQR.
- Option 2: Since $IQR=Q_3 - Q_1$, it means the middle half of the data has a range that is 43 minutes wide. This is correct.
- Option 3: The IQR is not related to the variation from the mean. Standard deviation is related to variation from the mean.
- Option 4: The difference between the smallest and largest values is the range, not the IQR.
Answer:
The middle half of the video game data has a range that is 43 minutes wide.