for a recent year, the following are the numbers of homicides that occurred each month in a city. use a 0.05…
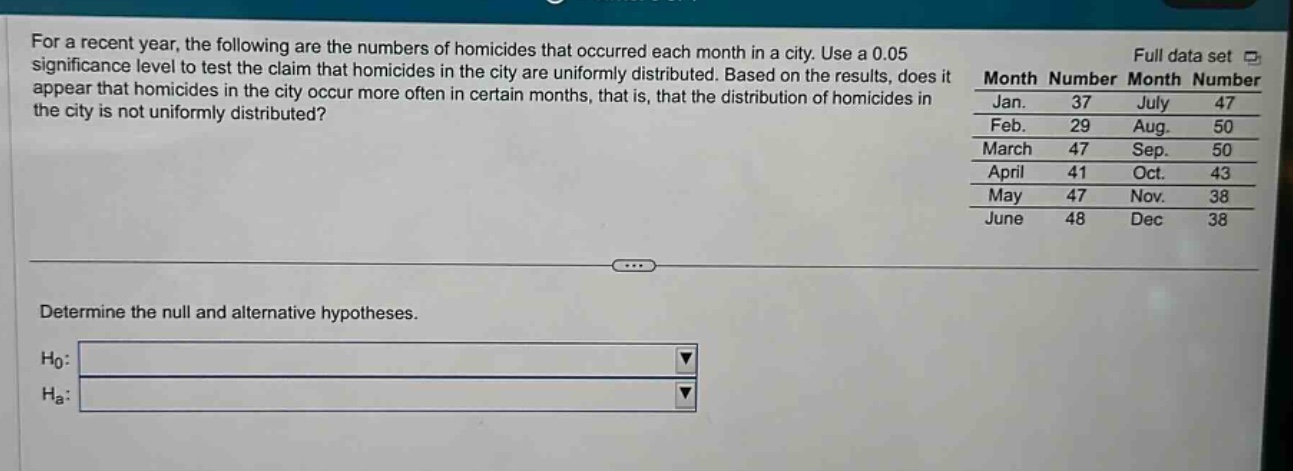
for a recent year, the following are the numbers of homicides that occurred each month in a city. use a 0.05 significance level to test the claim that homicides in the city are uniformly distributed. based on the results, does it appear that homicides in the city occur more often in certain months, that is, that the distribution of homicides in the city is not uniformly distributed? determine the null and alternative hypotheses. h0: ha:
Answer
Explanation:
Step1: Define null hypothesis
The null hypothesis ($H_0$) for a test of uniform - distribution is that the data follows a uniform distribution. In the context of monthly homicides, it means the number of homicides is equally likely to occur in each month. So, $H_0$: The distribution of homicides in the city is uniform.
Step2: Define alternative hypothesis
The alternative hypothesis ($H_a$) is the opposite of the null hypothesis. So, $H_a$: The distribution of homicides in the city is not uniform.
Answer:
$H_0$: The distribution of homicides in the city is uniform. $H_a$: The distribution of homicides in the city is not uniform.