records show that oliver is typically 10 - 30 minutes late for his shift at work. the distribution for the…
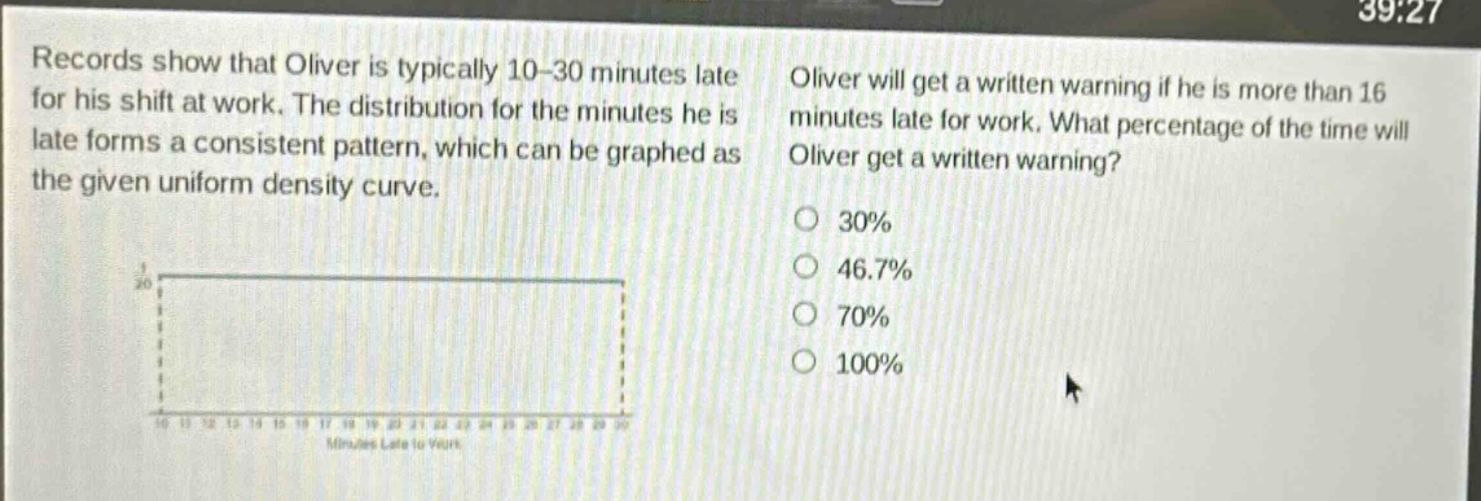
records show that oliver is typically 10 - 30 minutes late for his shift at work. the distribution for the minutes he is late forms a consistent pattern, which can be graphed as the given uniform density curve. oliver will get a written warning if he is more than 16 minutes late for work. what percentage of the time will oliver get a written warning? 30% 46.7% 70% 100%
Answer
Answer:
C. 70%
Explanation:
Step1: Identify the range of the uniform - distribution
The uniform distribution has a lower limit $a = 10$ and an upper limit $b = 30$. The probability density function of a uniform distribution $U(a,b)$ is $f(x)=\frac{1}{b - a}$ for $a\leq x\leq b$. Here, $f(x)=\frac{1}{30 - 10}=\frac{1}{20}$ for $10\leq x\leq 30$.
Step2: Calculate the probability of being more than 16 minutes late
We want to find $P(X>16)$. Using the formula for the probability of a uniform distribution $P(c<X<d)=\frac{d - c}{b - a}$ (where $a\leq c<d\leq b$). Here, $c = 16$, $a = 10$, and $b = 30$. So $P(X>16)=\frac{30 - 16}{30 - 10}=\frac{14}{20}=0.7$ or 70%.