records show that oliver is typically 10 - 30 minutes late for his shift at work. the distribution for the…
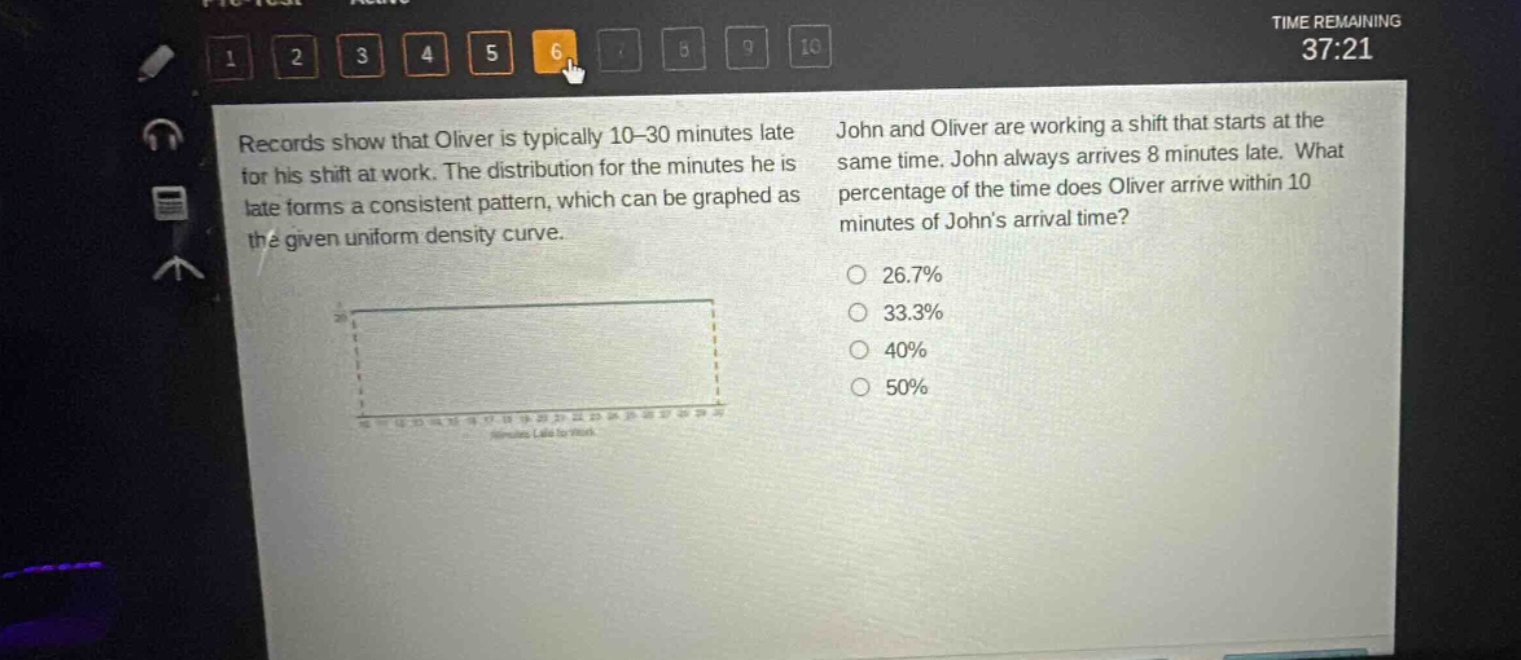
records show that oliver is typically 10 - 30 minutes late for his shift at work. the distribution for the minutes he is late forms a consistent pattern, which can be graphed as the given uniform density curve. john and oliver are working a shift that starts at the same time. john always arrives 8 minutes late. what percentage of the time does oliver arrive within 10 minutes of johns arrival time? 26.7% 33.3% 40% 50%
Answer
Answer:
C. 40%
Explanation:
Step1: Identify the range of Oliver's arrival
Oliver is 10 - 30 minutes late. John is 8 minutes late. We want to find when Oliver is within 10 minutes of John's arrival. So the favorable range for Oliver is from - 2 (8 - 10) to 18 (8+10) minutes late. But since Oliver's range is 10 - 30 minutes late, the overlapping favorable range is from 10 to 18 minutes late.
Step2: Calculate the length of total and favorable ranges
The total range of Oliver's lateness is $30 - 10=20$ minutes. The favorable range of Oliver's lateness (within 10 minutes of John) is $18 - 10 = 8$ minutes.
Step3: Calculate the probability
The probability $P$ of a uniform - distribution is given by $P=\frac{\text{Favorable range}}{\text{Total range}}$. So $P=\frac{8}{20}=0.4$ or 40%.