records show that oliver is typically 10 - 30 minutes late for his shift at work. the distribution for the…
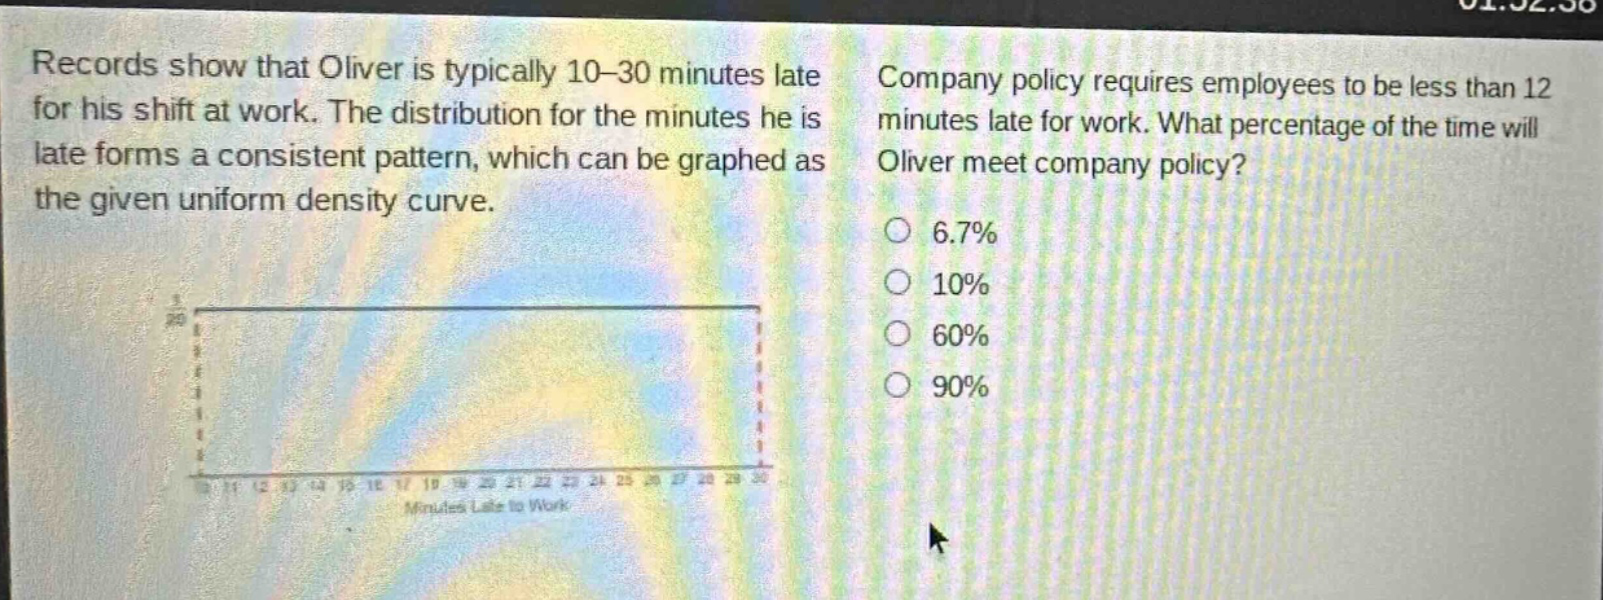
records show that oliver is typically 10 - 30 minutes late for his shift at work. the distribution for the minutes he is late forms a consistent pattern, which can be graphed as the given uniform density curve. company policy requires employees to be less than 12 minutes late for work. what percentage of the time will oliver meet company policy? 6.7% 10% 60% 90%
Answer
Answer:
10%
Explanation:
Step1: Identify range of distribution
The uniform - distribution is from 10 to 30 minutes late.
Step2: Determine favorable range
The company - required range is less than 12 minutes late. The favorable range is from 10 to 12 minutes late.
Step3: Calculate probability
The probability formula for a uniform distribution is $P=\frac{b - a}{B - A}$, where $a = 10$, $b = 12$, $A = 10$, $B = 30$. So $P=\frac{12 - 10}{30 - 10}=\frac{2}{20}=0.1$ or 10%.