a regression line was calculated for three similar data sets (a, b, and c) that measure the height of a…
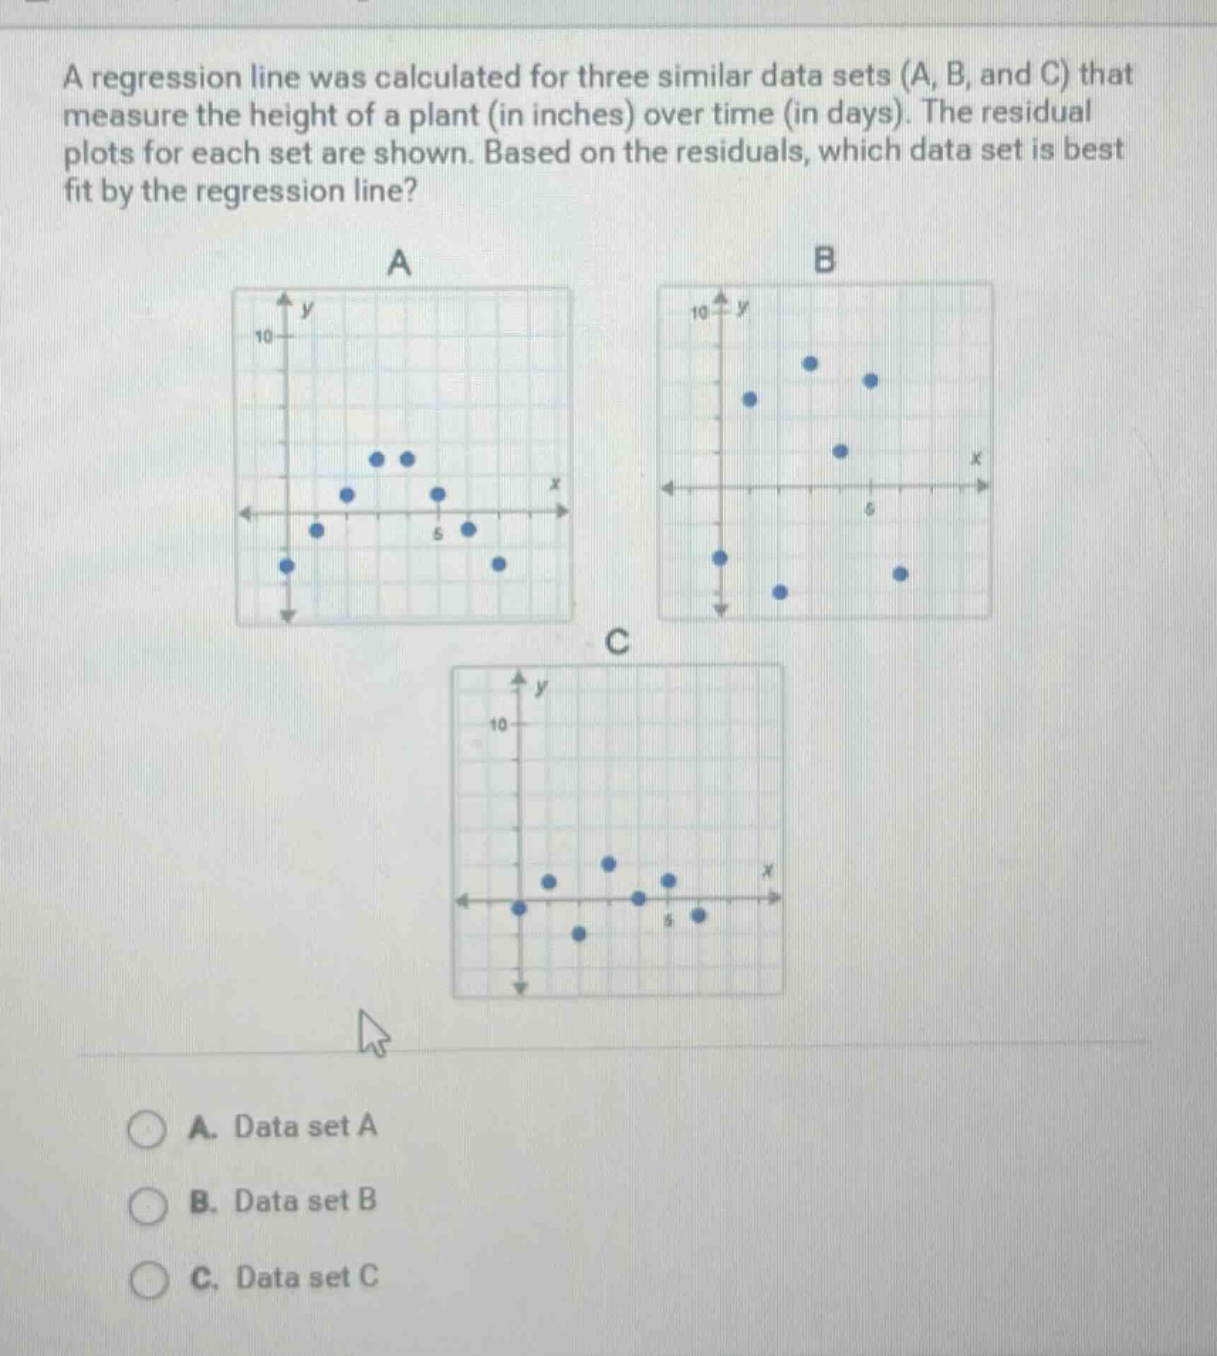
a regression line was calculated for three similar data sets (a, b, and c) that measure the height of a plant (in inches) over time (in days). the residual plots for each set are shown. based on the residuals, which data set is best fit by the regression line? a. data set a b. data set b c. data set c
Answer
Answer:
A. Data set A
Explanation:
Step1: Recall residual - plot concept
A good - fitting regression line has residuals randomly scattered around the horizontal axis.
Step2: Analyze data set A
In data set A, the residuals are randomly distributed around the x - axis.
Step3: Analyze data set B
In data set B, the residuals show a non - random pattern (a U - shape), indicating a poor fit.
Step4: Analyze data set C
In data set C, the residuals also show a non - random pattern, suggesting a poor fit.