the relationship between the number of months and cumulative cell - phone cost is represented by the scatter…
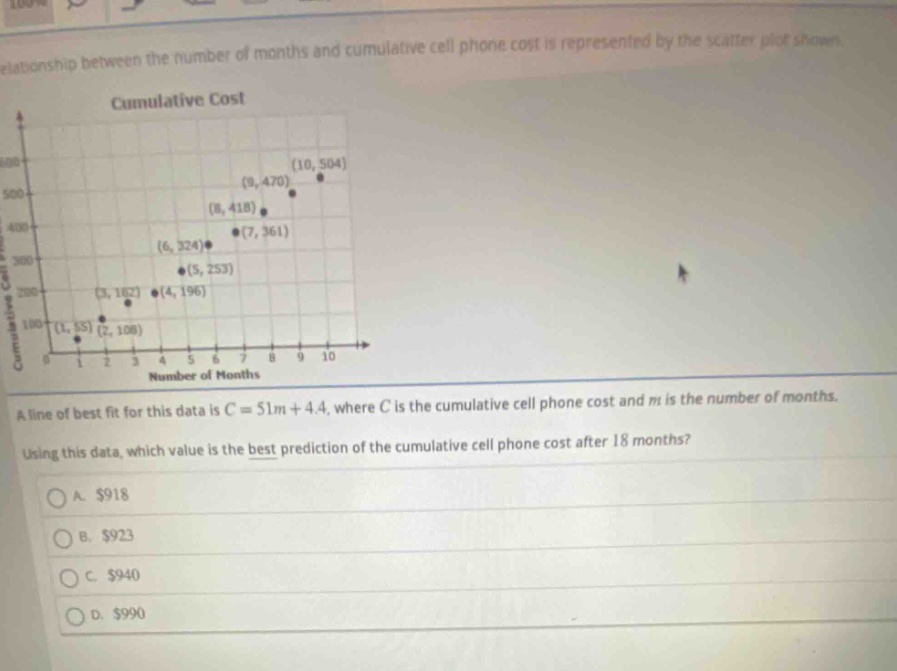
the relationship between the number of months and cumulative cell - phone cost is represented by the scatter plot shown.\na line of best fit for this data is $c = 51m+4.4$, where $c$ is the cumulative cell phone cost and $m$ is the number of months.\nusing this data, which value is the best prediction of the cumulative cell phone cost after 18 months?\na. $918\nb. $923\nc. $940\nd. $990
Answer
Answer:
B. $923
Explanation:
Step1: Identify the formula
$C = 51m+4.4$
Step2: Substitute the value of m
Substitute $m = 18$ into the formula: $C=51\times18 + 4.4$.
Step3: Calculate the product
$51\times18=918$.
Step4: Calculate the sum
$C=918 + 4.4=922.4\approx923$.