representing data using a two - way frequency table\nsurvey of 9th and 10th graders with siblings\nwhich…
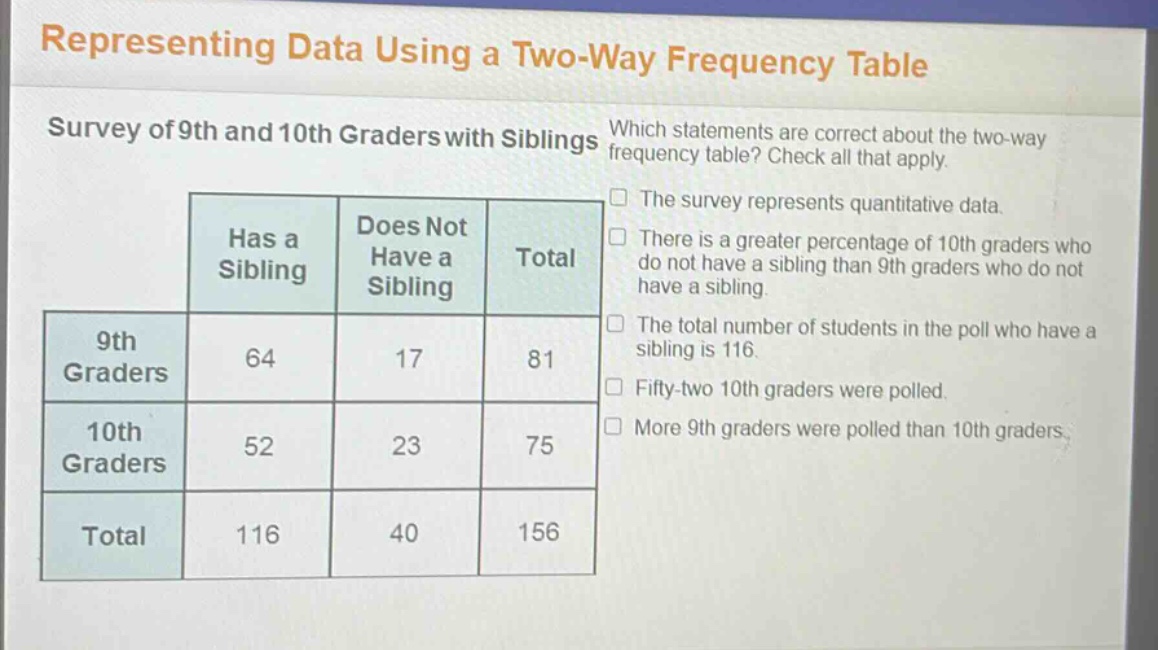
representing data using a two - way frequency table\nsurvey of 9th and 10th graders with siblings\nwhich statements are correct about the two - way frequency table? check all that apply.\nthe survey represents quantitative data.\nthere is a greater percentage of 10th graders who do not have a sibling than 9th graders who do not have a sibling.\nthe total number of students in the poll who have a sibling is 116.\nfifty - two 10th graders were polled.\nmore 9th graders were polled than 10th graders.\nhas a sibling|does not have a sibling|total\n9th graders|64|17|81\n10th graders|52|23|75\ntotal|116|40|156
Answer
Answer:
- B. There is a greater percentage of 10th - graders who do not have a sibling than 9th - graders who do not have a sibling.
- C. The total number of students in the poll who have a sibling is 116.
- E. More 9th - graders were polled than 10th - graders.
Explanation:
Step1: Analyze data type
The data is about counts of students with or without siblings by grade level, which is categorical data, not quantitative. So the statement about quantitative data is false.
Step2: Calculate percentages of non - sibling students
Percentage of 9th - graders without a sibling: $\frac{17}{81}\times100%\approx21%$. Percentage of 10th - graders without a sibling: $\frac{23}{75}\times100%\approx31%$. So there is a greater percentage of 10th - graders who do not have a sibling.
Step3: Check total number of students with siblings
Adding the number of 9th - graders with siblings (64) and 10th - graders with siblings (52) gives $64 + 52=116$.
Step4: Check number of 10th - graders polled
The total number of 10th - graders polled is 75, not 52.
Step5: Compare number of 9th and 10th - graders polled
81 9th - graders and 75 10th - graders were polled. So more 9th - graders were polled.