a research group studies student test performance. the group tracks hours of study and test score…
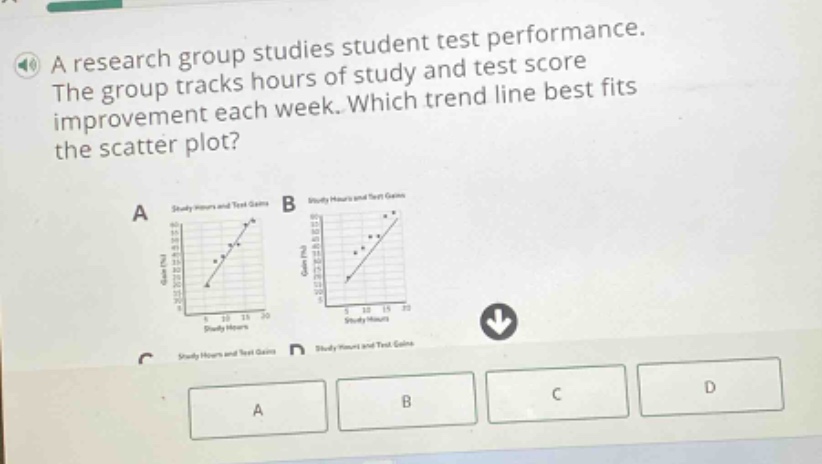
a research group studies student test performance. the group tracks hours of study and test score improvement each week. which trend line best fits the scatter plot? a study hours and test gains b study hours and test gains c study hours and test gains d study hours and test gains a b c d
Answer
Brief Explanations:
A trend line, or line of best fit, is a straight line on a scatter plot that best represents the general direction of the data. The line should be positioned such that it is as close as possible to all the data points, often with roughly an equal number of points above and below the line, and minimizing the sum of the squared distances from the points to the line.
Observing the provided scatter plots:
- Plot A: The trend line passes through some of the lower points in the dataset. Several points, especially at higher study hours, lie significantly above this line. This suggests the line might be underestimating the general trend.
- Plot B: The trend line appears to pass more centrally through the cloud of data points. There are points scattered both above and below the line across the range of study hours, and the line seems to balance these deviations more effectively than in Plot A. This indicates a better representation of the overall relationship between study hours and test gains.
Comparing the two, the trend line in Plot B provides a more balanced and representative fit for the depicted data points.
Answer:
B