a research group is trying to determine the correlation between the number of hours spent studying and the…
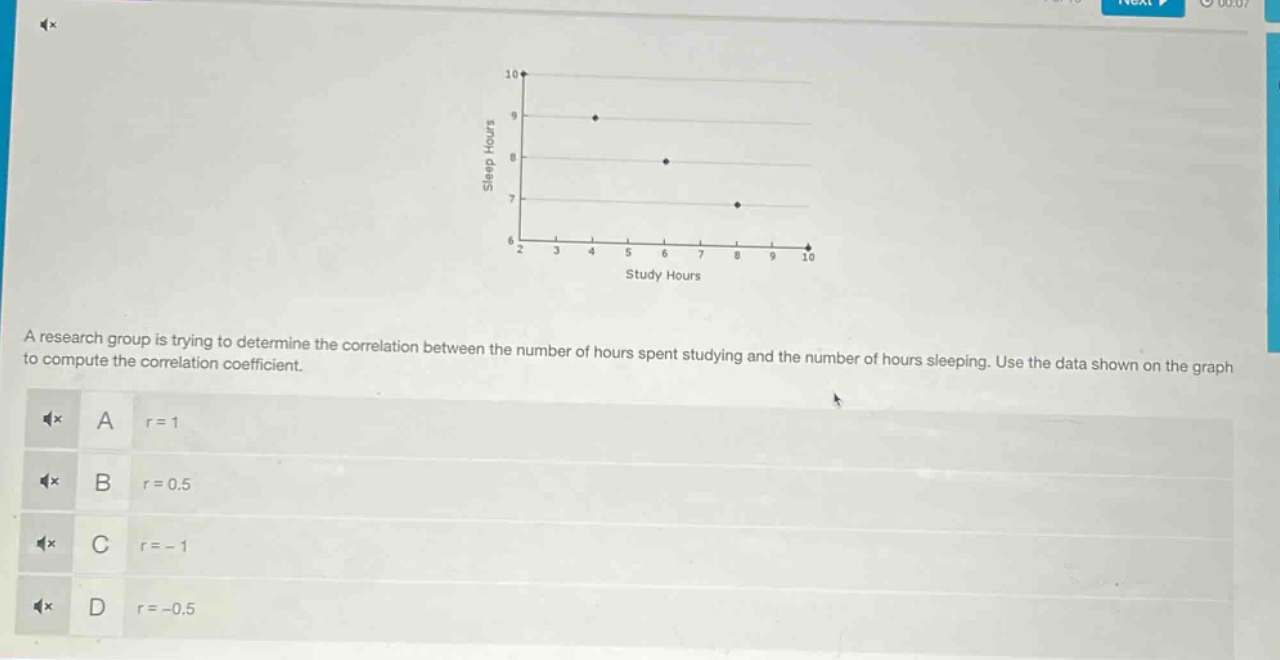
a research group is trying to determine the correlation between the number of hours spent studying and the number of hours sleeping. use the data shown on the graph to compute the correlation coefficient.\na r = 1\nb r = 0.5\nc r = - 1\nd r = -0.5
Answer
Explanation:
Step1: Observe the trend
As study - hours increase, sleep - hours decrease. So, it is a negative correlation.
Step2: Check the strength
The points seem to follow a relatively strong linear pattern. A correlation coefficient of - 1 represents a perfect negative linear correlation. Here, the points lie almost on a straight - line with a negative slope. So, the correlation coefficient $r=-1$.
Answer:
C. $r = - 1$