a research study was conducted to measure the time students focused on a task before being distracted. the…
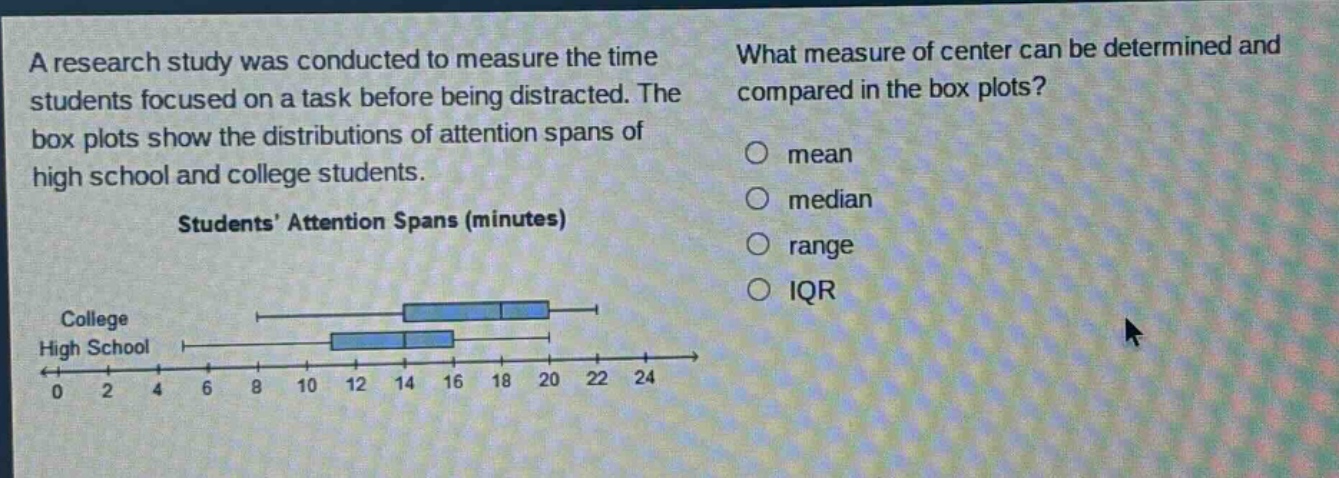
a research study was conducted to measure the time students focused on a task before being distracted. the box plots show the distributions of attention spans of high school and college students. students’ attention spans (minutes) what measure of center can be determined and compared in the box plots? mean median range iqr
Answer
Answer:
B. median
Explanation:
Step1: Recall box - plot features
A box - plot shows the five - number summary: minimum, first quartile ($Q_1$), median, third quartile ($Q_3$), and maximum.
Step2: Analyze measure of center
The mean is not shown on a box - plot. The range and IQR are measures of spread (range = maximum - minimum, IQR=$Q_3 - Q_1$). The median is the middle value of the data set and is represented by the line inside the box of the box - plot. So the measure of center that can be determined and compared in box - plots is the median.