a research study was conducted to measure the time students focused on a task before being distracted. the…
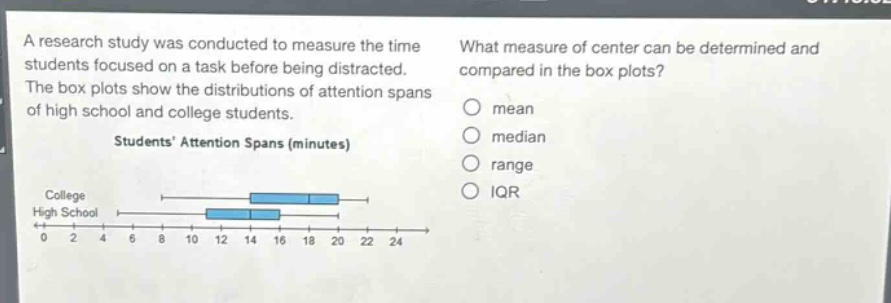
a research study was conducted to measure the time students focused on a task before being distracted. the box plots show the distributions of attention spans of high school and college students. students’ attention spans (minutes) college high school 0 2 4 6 8 10 12 14 16 18 20 22 24 what measure of center can be determined and compared in the box plots? mean median range iqr
Answer
Answer:
B. median
Explanation:
Step1: Recall box - plot features
A box - plot shows the five - number summary: minimum, first quartile ($Q_1$), median, third quartile ($Q_3$), and maximum.
Step2: Analyze measure of center
The mean is not shown on a box - plot. The range is the difference between the maximum and minimum values. The IQR (inter - quartile range) is $Q_3 - Q_1$. The median is the middle value of the data set and is represented by the line inside the box in a box - plot. So, the measure of center that can be determined and compared in box plots is the median.