a researcher studied the relationship between the number of times a certain species of cricket will chirp in…
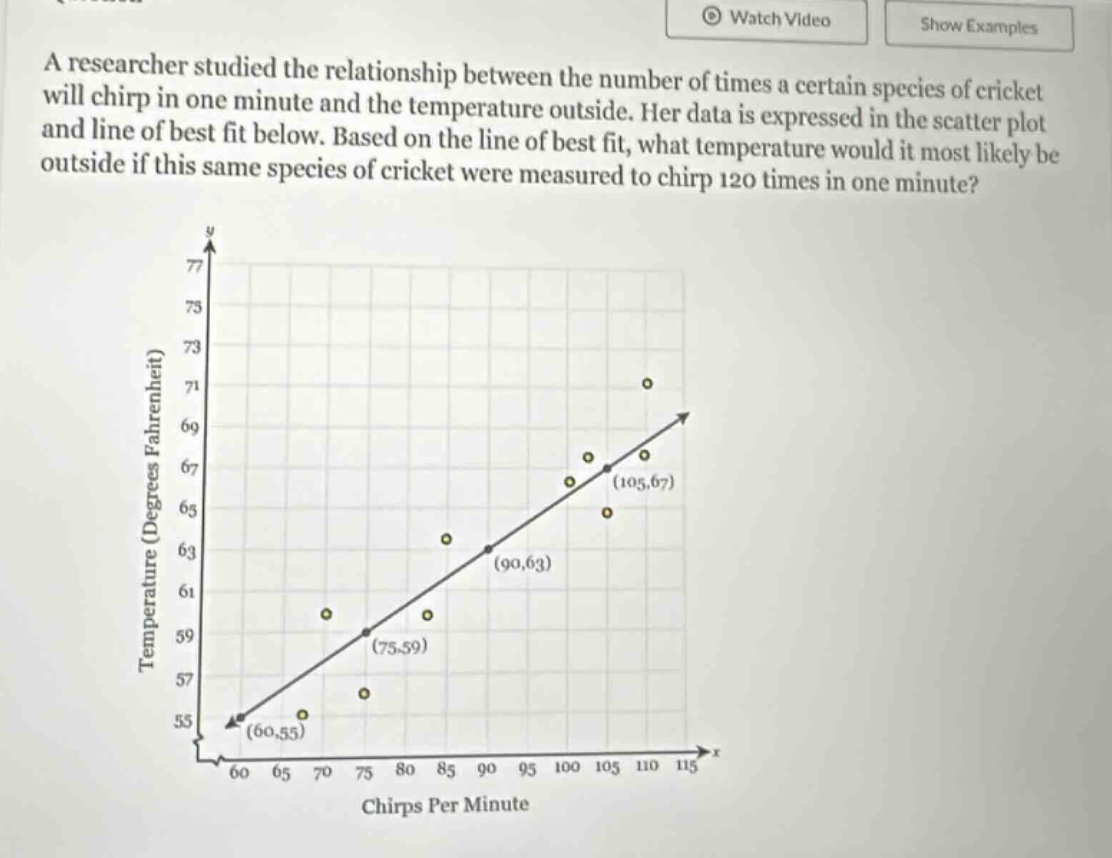
a researcher studied the relationship between the number of times a certain species of cricket will chirp in one minute and the temperature outside. her data is expressed in the scatter plot and line of best fit below. based on the line of best fit, what temperature would it most likely be outside if this same species of cricket were measured to chirp 120 times in one minute?
Answer
Explanation:
Step1: Find the slope of the line
The slope $m$ of a line passing through two points $(x_1,y_1)$ and $(x_2,y_2)$ is given by $m=\frac{y_2 - y_1}{x_2 - x_1}$. Let's take two points on the line of best - fit, say $(60,55)$ and $(90,63)$. Then $m=\frac{63 - 55}{90 - 60}=\frac{8}{30}=\frac{4}{15}$.
Step2: Find the y - intercept of the line
Using the point - slope form of a line $y - y_1=m(x - x_1)$ with the point $(60,55)$ and $m = \frac{4}{15}$, we have $y-55=\frac{4}{15}(x - 60)$. Expanding, $y-55=\frac{4}{15}x-16$. Then $y=\frac{4}{15}x + 39$.
Step3: Predict the temperature
We want to find $y$ when $x = 120$. Substitute $x = 120$ into the equation $y=\frac{4}{15}x+39$. So $y=\frac{4}{15}\times120 + 39$. First, $\frac{4}{15}\times120=32$. Then $y=32 + 39=71$.
Answer:
71