a residential community was polling households to find out whether they wanted to get their tv signal from a…
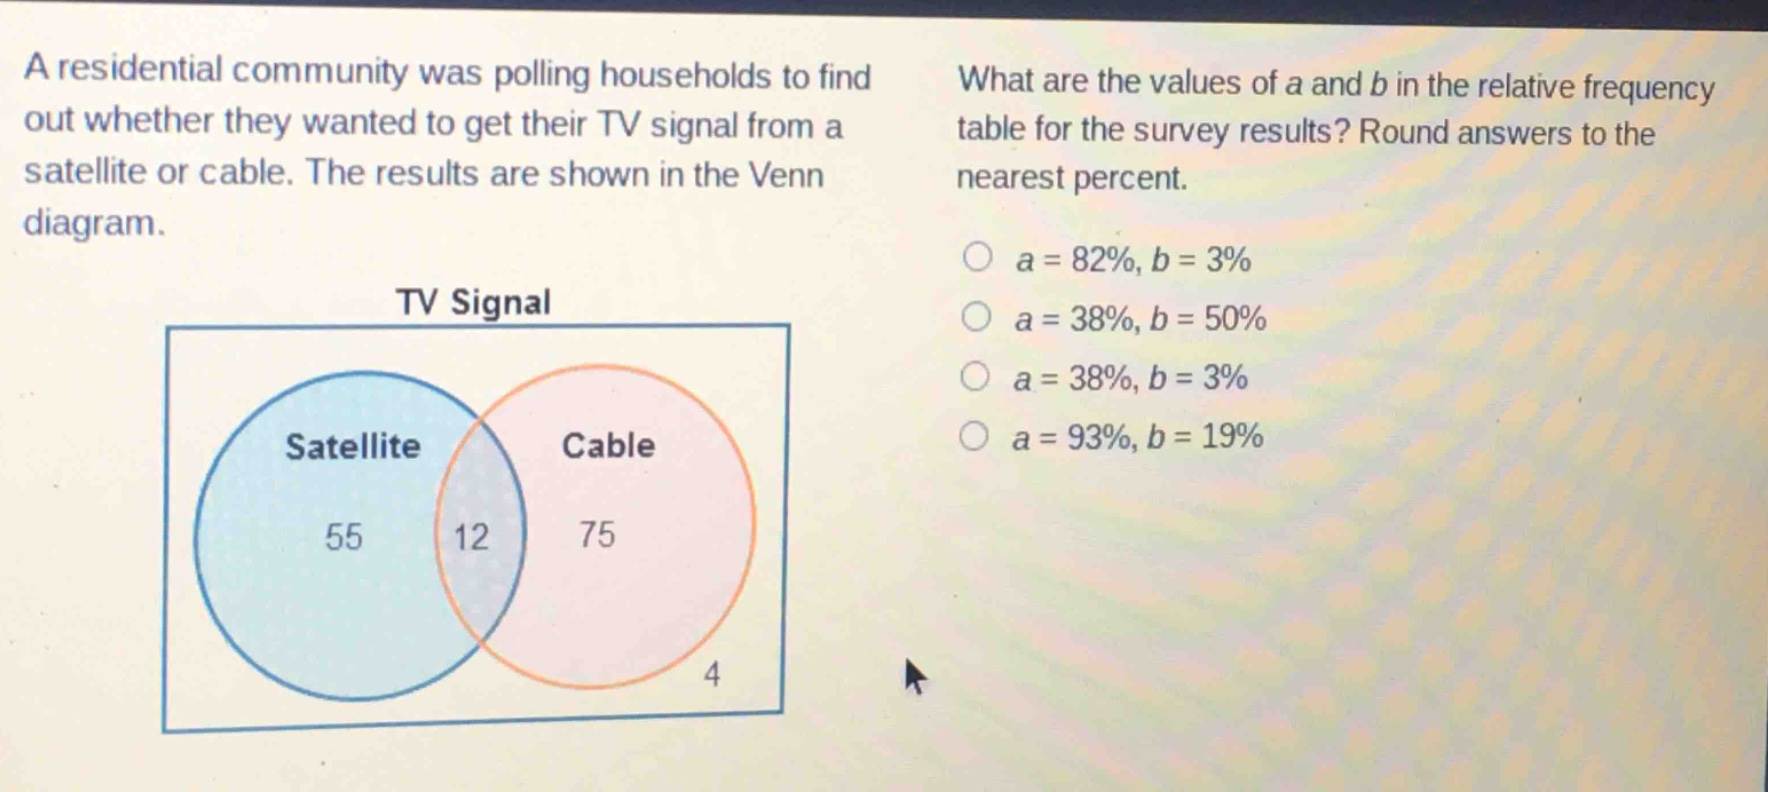
a residential community was polling households to find out whether they wanted to get their tv signal from a satellite or cable. the results are shown in the venn diagram. what are the values of a and b in the relative - frequency table for the survey results? round answers to the nearest percent. a = 82%, b = 3% a = 38%, b = 50% a = 38%, b = 3% a = 93%, b = 19%
Answer
Explanation:
Step1: Calculate total number of households
$55 + 12+75 + 4=146$
Step2: Calculate value of a (relative - frequency of only satellite)
$a=\frac{55}{146}\times100%\approx38%$
Step3: Calculate value of b (relative - frequency of only cable)
$b = \frac{75}{146}\times100%\approx50%$
Answer:
a = 38%, b = 50%