residents in a city are charged for water usage every three months. the water bill is computed from a common…
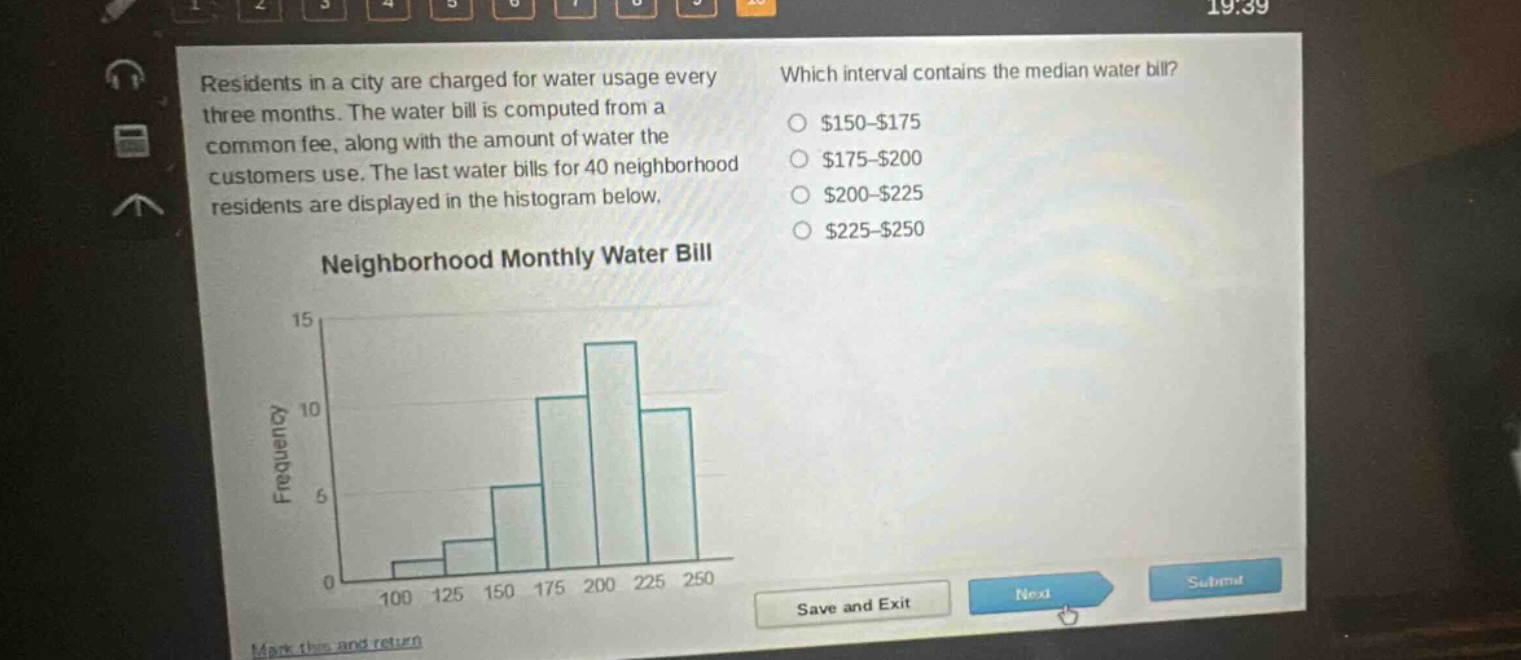
residents in a city are charged for water usage every three months. the water bill is computed from a common fee, along with the amount of water the customers use. the last water bills for 40 neighborhood residents are displayed in the histogram below. which interval contains the median water bill? $150 - $175 $175 - $200 $200 - $225 $225 - $250 neighborhood monthly water bill
Answer
Explanation:
Step1: Calculate position of median
Since $n = 40$ (even - numbered data set), the median is the average of the $\frac{n}{2}=20$th and $(\frac{n}{2}+ 1)=21$st ordered data - values.
Step2: Find cumulative frequencies
From the histogram, the frequencies for the intervals are:
- For $100 - 125$: $2$
- For $125 - 150$: $3$
- For $150 - 175$: $6$
- For $175 - 200$: $10$
- For $200 - 225$: $14$
- For $225 - 250$: $5$ The cumulative frequencies are:
- For $100 - 125$: $2$
- For $125 - 150$: $2 + 3=5$
- For $150 - 175$: $5+6 = 11$
- For $175 - 200$: $11 + 10=21$
Step3: Determine median - containing interval
The $20$th and $21$st ordered data - values fall within the $175 - 200$ interval.
Answer:
$175 - 200$