this is the residual plot for a data set and its regression line. what conclusions can you draw? select all…
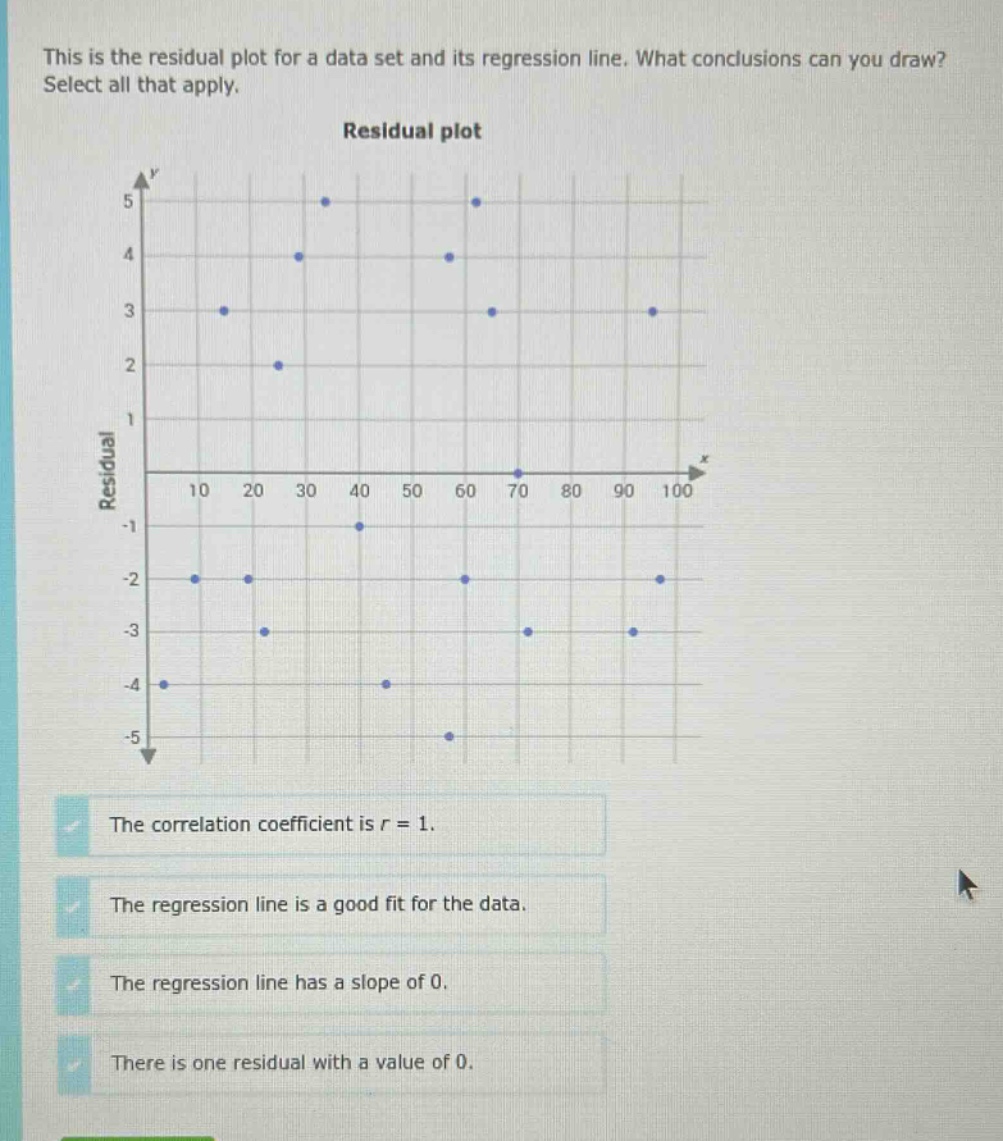
this is the residual plot for a data set and its regression line. what conclusions can you draw? select all that apply.\nresidual plot\nthe correlation coefficient is r = 1.\nthe regression line is a good fit for the data.\nthe regression line has a slope of 0.\nthere is one residual with a value of 0.
Answer
Brief Explanations:
- A correlation coefficient of $r = 1$ indicates a perfect positive - linear relationship. But the residual plot doesn't show a perfect linear pattern, so this is incorrect.
- For a regression line to be a good fit, residuals should be randomly scattered around the zero - line. Here, the pattern is not random, so this is incorrect.
- If the regression line has a slope of 0, the line is horizontal and there is no linear relationship between variables. The plot doesn't suggest this.
- We can see a point on the zero - residual line, so there is one residual with a value of 0. This is correct.
Answer:
There is one residual with a value of 0.