a residual plot is shown. which statements are true about the residual plot and the equation for the line of…
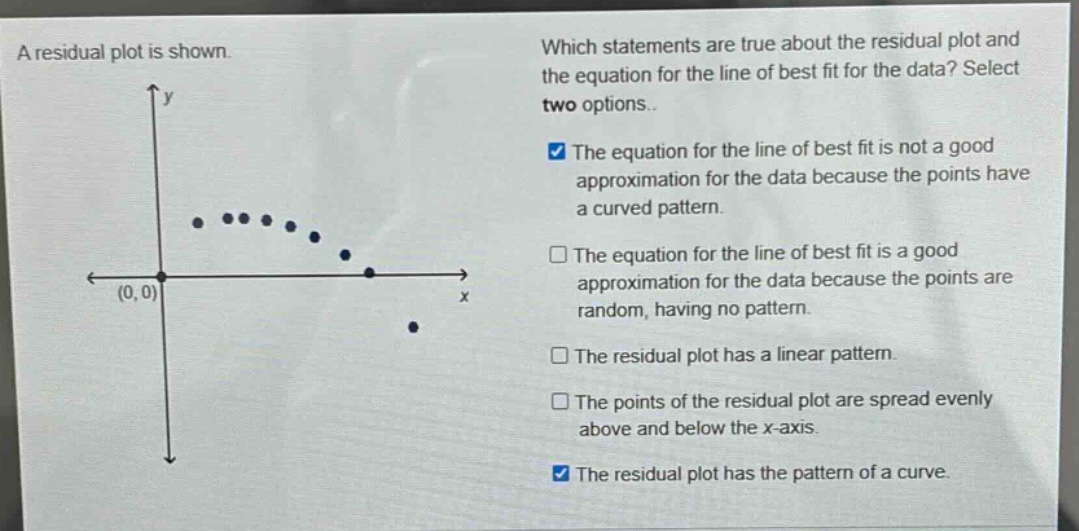
a residual plot is shown. which statements are true about the residual plot and the equation for the line of best fit for the data? select two options. the equation for the line of best fit is not a good approximation for the data because the points have a curved pattern. the equation for the line of best fit is a good approximation for the data because the points are random, having no pattern. the residual plot has a linear pattern. the points of the residual plot are spread evenly above and below the x - axis. the residual plot has the pattern of a curve.
Answer
Brief Explanations:
In a good - fitting linear model, the residual plot should have points randomly scattered around the x - axis with no pattern. Here, the points in the residual plot have a curved pattern. This indicates that the line of best fit is not a good approximation for the data. Also, clearly the pattern of the points in the residual plot is curved, not linear or evenly spread above and below the x - axis.
Answer:
The equation for the line of best fit is not a good approximation for the data because the points have a curved pattern. The residual plot has the pattern of a curve.