which residual plot shows that the line of best fit is a good model?
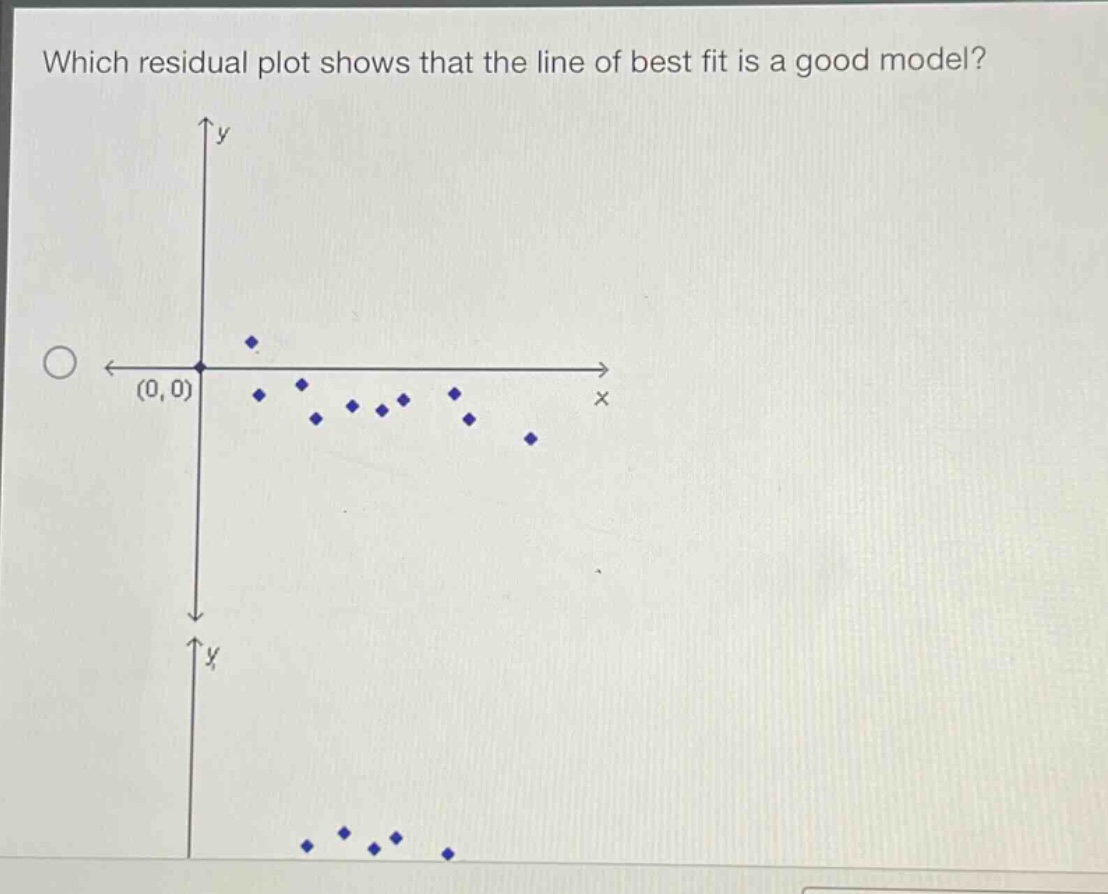
which residual plot shows that the line of best fit is a good model?
Answer
Explanation:
Step1: Recall residual - plot criteria
For a line of best fit to be a good model, the residuals (the differences between the observed and predicted values) should be randomly scattered around the horizontal axis (residual = 0).
Step2: Analyze the given plot
In the given plot, the points are not randomly scattered. They seem to follow a pattern (a curve - like shape), which indicates that the line of best fit is not a good model. A good residual plot would have points evenly distributed above and below the x - axis with no discernible pattern (such as a curve or a trend). Since no other plots are provided, we assume we are just analyzing this one in terms of the general principle.
Answer:
This plot does not show that the line of best fit is a good model.