which residual plot shows that the model is a good fit for the data?
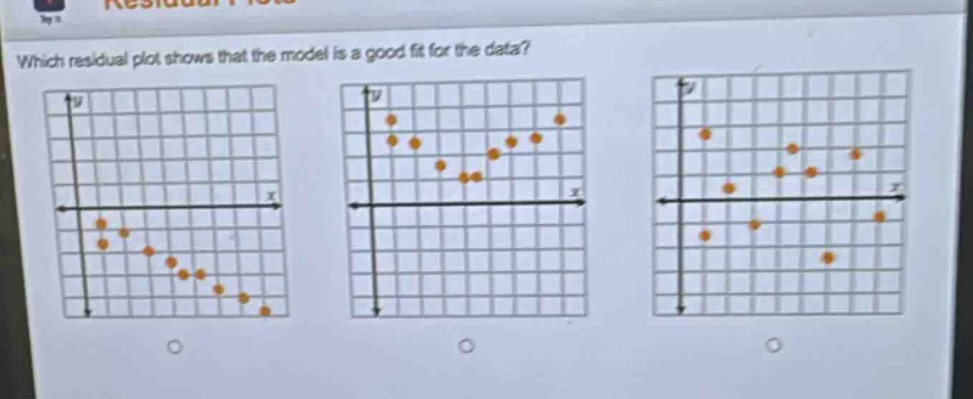
which residual plot shows that the model is a good fit for the data?
Answer
Explanation:
Step1: Recall residual - plot criteria
A good - fitting model has residuals that are randomly scattered around the horizontal axis.
Step2: Analyze first plot
The first plot has a clear pattern (a downward - sloping trend), so it is not a good fit.
Step3: Analyze second plot
The second plot has a U - shaped pattern, so it is not a good fit.
Step4: Analyze third plot
The third plot has points randomly scattered around the horizontal axis, indicating a good fit.
Answer:
The third residual plot.