some residuals for a scatterplot are given. for x = 3, the residual is -5. for x = 5, the residual is -1…
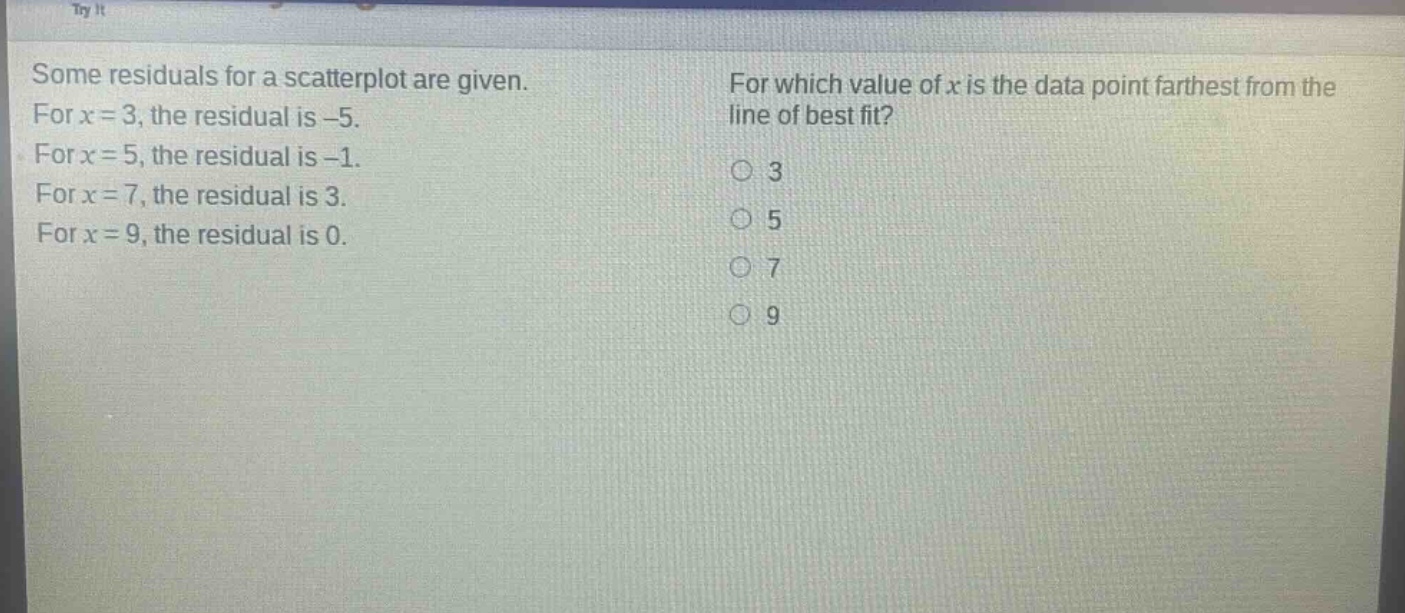
some residuals for a scatterplot are given. for x = 3, the residual is -5. for x = 5, the residual is -1. for x = 7, the residual is 3. for x = 9, the residual is 0. for which value of x is the data point farthest from the line of best fit? 3 5 7 9
Answer
Answer:
A. 3
Explanation:
Step1: Recall residual concept
The magnitude of the residual represents the distance of a data - point from the line of best fit.
Step2: Compare residual magnitudes
For (x = 3), residual (| - 5|=5); for (x = 5), residual (| - 1| = 1); for (x = 7), residual (|3|=3); for (x = 9), residual (|0| = 0).
Step3: Determine the largest residual
Since (5>3 > 1>0), the data - point with (x = 3) is farthest from the line of best fit.