a restaurant records the number of tables served each night, and the results have the values: minimum = 3…
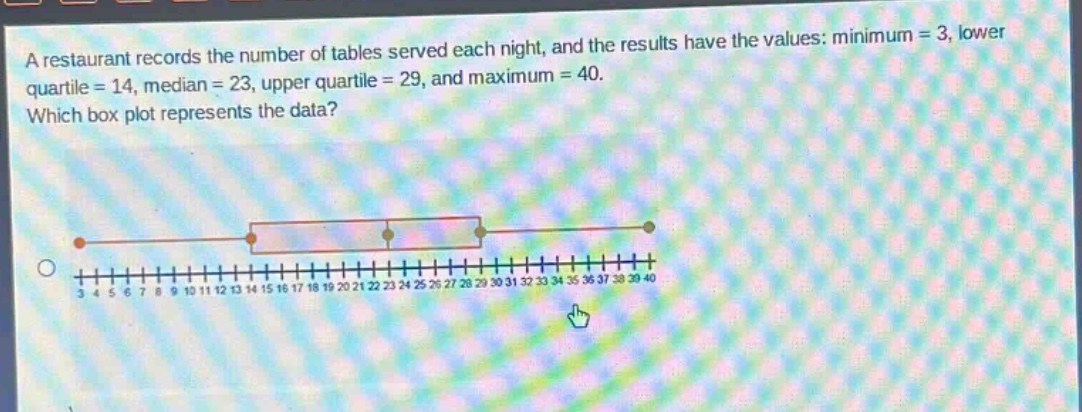
a restaurant records the number of tables served each night, and the results have the values: minimum = 3, lower quartile = 14, median = 23, upper quartile = 29, and maximum = 40. which box plot represents the data?
Answer
Explanation:
Step1: Recall box - plot components
A box - plot has a minimum value, lower quartile ($Q_1$), median ($Q_2$), upper quartile ($Q_3$), and maximum value. The left - most point is the minimum, the left edge of the box is $Q_1$, the line inside the box is $Q_2$, the right edge of the box is $Q_3$, and the right - most point is the maximum.
Step2: Identify values
We are given minimum = 3, lower quartile ($Q_1$)=14, median ($Q_2$)=23, upper quartile ($Q_3$)=29, and maximum = 40.
Step3: Check the box - plot
We need to find a box - plot where the left - most point is at 3, the left edge of the box is at 14, the line inside the box is at 23, the right edge of the box is at 29, and the right - most point is at 40.
Answer:
The box - plot that has the left - most point at 3, left edge of the box at 14, line inside the box at 23, right edge of the box at 29, and right - most point at 40 represents the data. (Since no other box - plots are shown in the problem description, if this was a multiple - choice question with other options, we would compare based on the above values).