rodrigo works at a flower shop. he recorded how many flowers each customer purchased yesterday. this box…
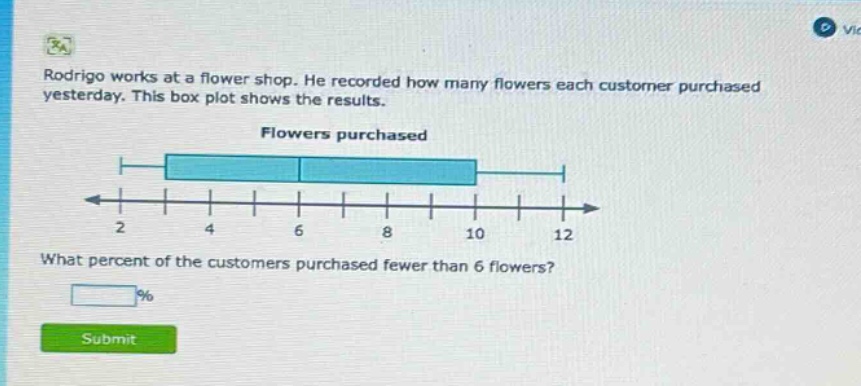
rodrigo works at a flower shop. he recorded how many flowers each customer purchased yesterday. this box plot shows the results. flowers purchased what percent of the customers purchased fewer than 6 flowers? % submit
Answer
Explanation:
Step1: Recall box - plot properties
In a box - plot, the left - hand side of the box represents the first quartile ($Q_1$), the line inside the box represents the median ($Q_2$), and the right - hand side of the box represents the third quartile ($Q_3$). The whiskers represent the minimum and maximum values within 1.5 times the inter - quartile range (IQR) from $Q_1$ and $Q_3$ respectively.
Step2: Identify quartile values
The value 6 in the box - plot is the first quartile ($Q_1$). By definition, 25% of the data lies below the first quartile.
Answer:
25