ron volunteered at the barton community centers walkathon. he tracked how many miles each team walked…
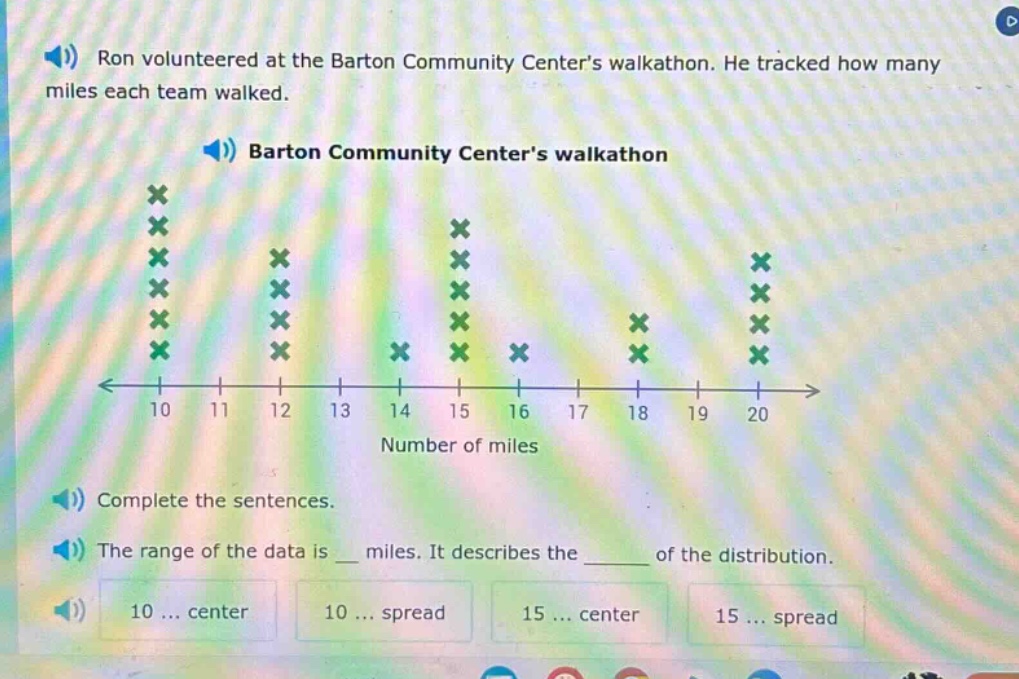
ron volunteered at the barton community centers walkathon. he tracked how many miles each team walked. barton community centers walkathon complete the sentences. the range of the data is _ miles. it describes the _ of the distribution. 10 ... center 10 ... spread 15 ... center 15 ... spread
Answer
Explanation:
Step1: Identify max and min values
The minimum value in the data - set from the dot - plot is 10 miles and the maximum value is 20 miles.
Step2: Calculate the range
The range is calculated as (Range = Max - Min). So, (Range=20 - 10=10) miles. The range describes the spread of the distribution.
Answer:
10 ... spread