roxy has received the following quiz scores so far this year: 75, 88, 90, 96, 98, 100. which box plot…
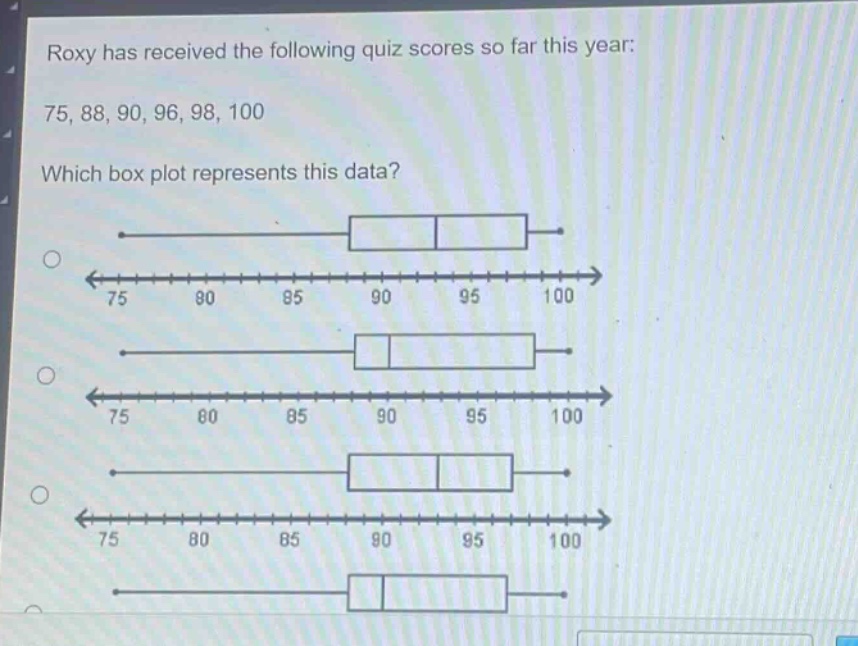
roxy has received the following quiz scores so far this year: 75, 88, 90, 96, 98, 100. which box plot represents this data?
Answer
Explanation:
Step1: Find the minimum value
The minimum value of the data - set (75,88,90,96,98,100) is (75).
Step2: Find the first - quartile ((Q_1))
First, order the data: (75,88,90,96,98,100). Since (n = 6) (even number of data points), the lower half of the data is (75,88,90). The median of the lower half ((Q_1)) is (88).
Step3: Find the median ((Q_2))
Since (n = 6), the median is the average of the (\frac{n}{2})th and ((\frac{n}{2}+1))th ordered data points. (\frac{6}{2}=3) and (\frac{6}{2}+1 = 4). The median (Q_2=\frac{90 + 96}{2}=93).
Step4: Find the third - quartile ((Q_3))
The upper half of the data is (96,98,100). The median of the upper half ((Q_3)) is (98).
Step5: Find the maximum value
The maximum value of the data - set is (100).
A box - plot has a whisker from the minimum value ((75)) to (Q_1 = 88), a box from (Q_1 = 88) to (Q_3 = 98) with a line inside the box at the median (Q_2=93), and a whisker from (Q_3 = 98) to the maximum value ((100)).
We need to visually check which of the given box - plots has the minimum at (75), (Q_1) at (88), median around (93), (Q_3) at (98), and maximum at (100).
Answer:
(Without seeing the full - fledged options clearly, we can't give a specific option. But the correct box - plot should have a left - most point at (75), the left - hand side of the box at (88), a vertical line in the box around (93), the right - hand side of the box at (98), and a right - most point at (100).)