ryan asked 80 students at his school whether they prefer to drink flavored water or unflavored water. this…
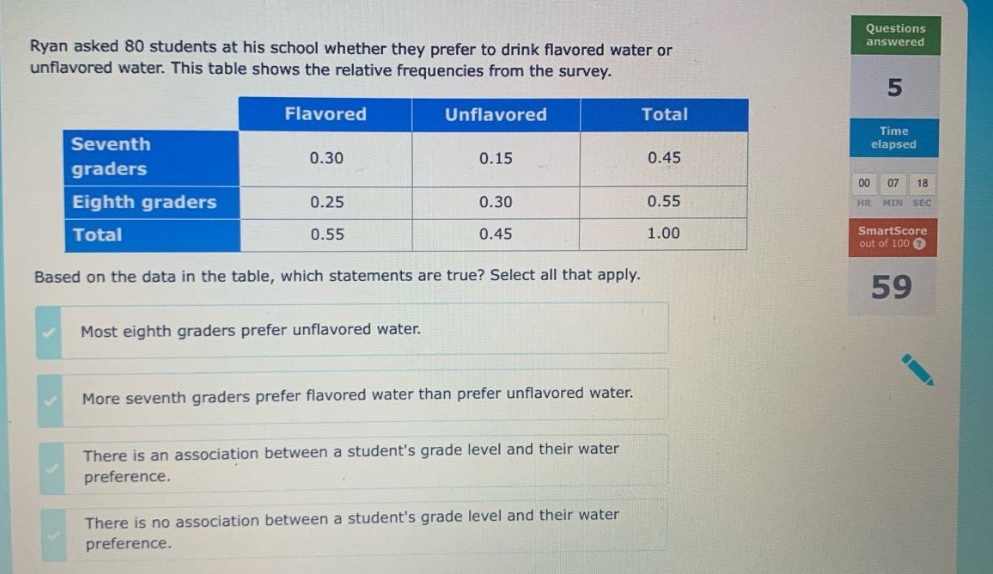
ryan asked 80 students at his school whether they prefer to drink flavored water or unflavored water. this table shows the relative frequencies from the survey. based on the data in the table, which statements are true? select all that apply. most eighth - graders prefer unflavored water. more seventh - graders prefer flavored water than prefer unflavored water. there is an association between a students grade level and their water preference. there is no association between a students grade level and their water preference.
Answer
Explanation:
Step1: Analyze eighth - graders' preference
For eighth - graders, the relative frequency of preferring flavored water is 0.25 and for unflavored water is 0.30. Since 0.30>0.25, most eighth - graders prefer unflavored water.
Step2: Analyze seventh - graders' preference
For seventh - graders, the relative frequency of preferring flavored water is 0.30 and for unflavored water is 0.15. Since 0.30>0.15, more seventh - graders prefer flavored water than unflavored water.
Step3: Check for association
The relative frequencies of water preference are different for seventh and eighth graders. For example, the proportion of flavored water preference is 0.30 for seventh - graders and 0.25 for eighth - graders. So, there is an association between a student's grade level and their water preference.
Answer:
Most eighth graders prefer unflavored water. More seventh graders prefer flavored water than prefer unflavored water. There is an association between a student's grade level and their water preference.